
Search “sales call statistics” and you will find the same numbers everywhere: dial counts, connect rates, cold email reply rates, how many follow-ups it takes before a prospect answers. These are useful information but all of it describes what happens before a conversation starts.
What about what happens once someone picks up the phone?
Contact centers and sales floors manually review a tiny slice of their calls, so nobody has enough data to publish.
It’s why we scored 6,209 real sales conversations across 12 behavioral dimensions, then ran the same scoring model against hundreds more calls each in insurance, wellness, and manufacturing.
What you see beloe is every figure from those four studies, organized by theme, plus sourced statistics from outside research that round out the picture.
Conversation Behavior Statistics From 6,209 Scored Sales Calls (1-16)
All figures below come from The DNA of High-Performing Reps, the first release in Insight7’s Call Analytics Index.
- Insight7 scored 6,209 real sales conversations across 12 behavioral dimensions. Source
- Just 427 of those calls, 6.9% of the total, rated Excellent. Source
- 1,238 calls (19.9%) landed in the Good tier. Source
- 3,979 calls (64.1%) rated Average, the largest single group by far. Source
- 565 calls (9.1%) rated Poor. Source
- Reps in the Excellent tier asked 14.3 questions per call against 10.4 for the Average tier, a 37% difference. Source
- Question density told an even sharper story: 1.2 questions per minute for Excellent calls versus 0.6 for Average calls, exactly double. Source
- Excellent-tier calls held a nearly even 1:1 speaker split; Poor-tier calls ran 1:8, meaning the rep did almost all the talking. Source
- Turn Balance Score (lower means more even) came in at 0.4 for Excellent calls and 1.2 for Poor calls. Source
- Excellent-tier calls scored 4.8 on Actionable Outcomes against 3.3 for Average calls, a 45% lift. Source
- Information Density ran 27% higher in Excellent calls than the study baseline. Source
- Empathy & Rapport produced the single widest gap of all 12 dimensions: 4.7 for Excellent calls against 2.8 for Poor calls, a 68% spread. Source
- Enthusiasm Score sat 35% above baseline for Excellent-tier conversations. Source
- Exclamation count was 2.4 times higher in Excellent calls than the baseline. Source
- Of all 12 dimensions measured, Actionable Outcomes separated the tiers most sharply, at 72.0%. Source
- Problem Resolution (56.0% separation) and Goal Achievement (53.8%) ranked second and third. Source
How to use this: if you’re only going to coach toward one number this quarter, the data points to Actionable Outcomes, since it separates strong calls from average ones more than any other measured behavior.
AI Coaching can turn a low Actionable Outcomes score into a targeted practice scenario automatically, rather than a generic note to “be more decisive on the call.”
Close Rate Benchmarks by Industry (17-40)
| Industry | Best-performing tier | Weakest tier | Widest gap |
|---|---|---|---|
| Insurance (quote to bound policy) | 65.4% close rate | 0% | Funnel Performance, 204% |
| Wellness/health coaching (enrollment) | 100% | 33% | Conversion & Close Execution, 48% |
| Manufacturing (inbound quote to order) | 29% placed an order | 0% | Conversion & Close Execution, 77% |
| Cross-industry (all calls scored Excellent) | 6.9% | N/A | N/A |
- Agents in the top quarter of insurance sales conversations bound policies on 65.4% of calls; agents in the bottom quarter bound zero, on identical leads and identical products. Source
- Funnel Performance produced a 204% gap between those two groups, the widest of any dimension measured in the insurance study. Source
- Leading insurance agents asked 7 questions per call, about 2 of them open-ended; the weakest group asked 3, fewer than 1 open-ended. Source
- Calls from the strongest agents generated 16.1 customer turns; calls from the weakest generated 3.2, a fivefold gap in how much the customer spoke. Source
- Talk ratio ran 4:1 (agent to customer) among the best insurance agents and 12:1 among the worst. Source
- Naming carriers mattered more than most agents assume: 1.69 carriers mentioned per call among top agents versus 0.12 among the weakest, a 108% gap. Source
- Objection Handling showed the smallest gap in the insurance study, just 21%, because weak calls rarely lasted long enough for an objection to come up. Source
- Getting an insurance customer onto the phone costs $500 to $900 in acquisition spend before an agent says a word. Source
- In the wellness study, advisors in the top 30% enrolled 100% of patients; advisors in the bottom 15% enrolled 33%, working the same programs at the same price. Source
- Conversion & Close Execution drove the biggest split among wellness advisors, at 48%. Source
- Compliance & Process Excellence accounted for a 40% gap, second-widest in the wellness study. Source
- Emotional Connection & Trust produced a 36% spread between the strongest and weakest advisors. Source
- Consultations run by lower-performing wellness advisors saw the advisor talking 80% or more of the time; the benchmark for top performers is 65% or below. Source
- Enrollment odds rose once the patient accounted for 35% or more of the conversation. Source
- 62% of U.S. adults reported using a complementary or alternative therapy in 2024, part of the crowded market these consultations compete inside. Source
- In manufacturing, reps in the top quarter placed an order on 29% of calls; reps in the bottom fifth placed zero, despite working from the same price book. Source
- Conversion & Close Execution again produced the widest split, 77%, in the manufacturing dataset. Source
- 43% of all manufacturing calls were explicit requests for a quote, and only 26% of those callers got an actual price while still on the phone. Source
- Reps who quoted pricing live on the call did so 33% of the time in the top group and 0% of the time in the bottom group. Source
- Project discovery happened on 88% of calls from the strongest reps and just 20% of calls from the weakest, a 47% gap. Source
- Product Knowledge & Communication accounted for a 24% spread in manufacturing calls. Source
- Customer Experience & Rapport was the smallest manufacturing gap at 14%, largely explained by whether the rep opened with a proper greeting or a flat “hello.” Source
- Only 14% of manufacturing calls included any cross-sell attempt at all; the strongest reps tried it 17% of the time, the weakest tried it never. Source
- Across the general cross-industry dataset, 6.9% of scored calls reached the Excellent tier, the composite figure the three vertical studies above can be compared against. Source
How to use this: Before investing coaching hours in product knowledge or scripting, check whether reps are reaching a genuine close attempt at all. Sales Coaching built around your team’s own close-attempt rate is a faster fix than a broader training overhaul.
Sales Coaching Benchmarks From Real Call Data (41-50)
- Aim for more than 12 questions per call. Reps below that line were consistently in the lower performance tiers across the cross-industry dataset. Source
- Keep Turn Balance Score under 1.2. Once a rep crosses that line, the call functions more like a presentation than a conversation. Source
- An Actionable Outcomes score above 4.5 is the target drawn from the top-performing tier. Source
- Empathy should sit above 4.5 as well, given it produced the widest single gap in the whole study. Source
- In insurance specifically, funnel completion should read 8.5 out of 10 or higher; the current average sits at 5.87. Source
- Insurance agents should be naming two or more carriers per call; the average agent currently names 1.04. Source
- Wellness advisors should be scoring 8.5 or higher on conversion, well above the current team average of 5.90. Source
- A wellness turn balance ratio at or below 1.2 is the benchmark for a genuinely two-way consultation. Source
- Manufacturing reps should target a conversion score of 7.5 or higher out of 10, up from a current average of 5.90. Source
- Cross-sell attempts should appear on half of all manufacturing quote calls, a steep climb from the current 14%. Source
How to use this: pick two or three of these targets, not all ten at once. Every one of the four Insight7 studies recommends fixing close-attempt behavior first, since coaching objection handling or product knowledge does little for a rep who never reaches the point where either skill gets used.
AI Roleplays can build practice scenarios directly from a rep’s own scored gap rather than a generic script.
QA Coverage and Call Sample Size Statistics (51-53)
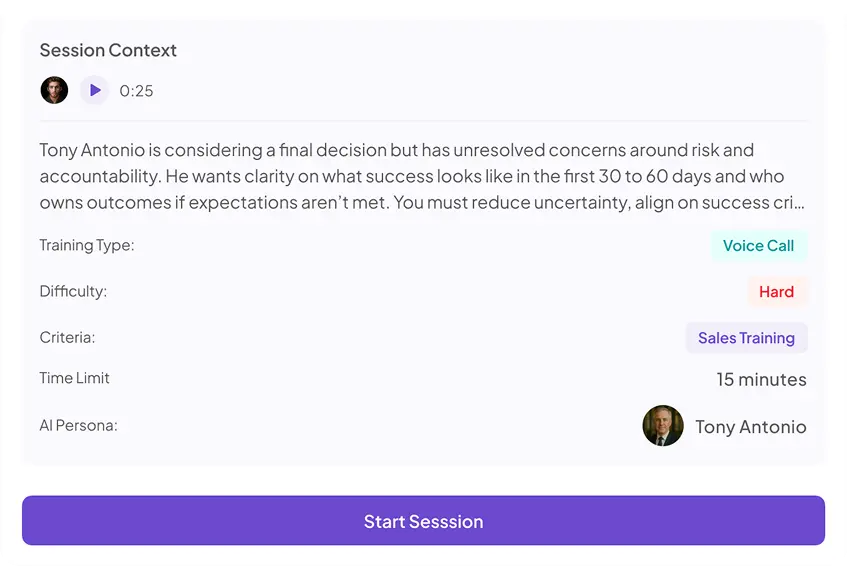
- Manual quality assurance typically covers under 5% of customer conversations. Source
- Human-reviewed QA scoring runs at 70-80% accuracy. Source
- Entel Connect Center in Peru fields more than 600,000 inbound calls a month and, before automating analysis, could review fewer than 1% of them. Once every call was analyzed instead of a sample, their service sales climbed 40% inside ten weeks. Source
How to use this: if your QA program samples calls the traditional way, the honest question is whether 2-5% is even enough data to know what “normal” looks like on your floor.
Tools like Insight7’s Call Quality Assurance scores every recorded call instead of a handful, which is the only way most of the gaps above ever get seen at all.
Sales Quota Attainment and Coaching Frequency Statistics (59-66)
- Account executive quota attainment slipped to 48% in 2026, down from 51% in 2024. That figure is drawn from 158 B2B companies surveyed by the Bridge Group. Source
- Reps who get coached weekly hit quota 76% of the time; the figure drops to 47% for reps coached quarterly or less often. Source
- A middle tier exists too: reps coached monthly land around 56% quota attainment, between the weekly and quarterly groups. Source
- 41% of surveyed sales reps report being coached rarely or never. Source
- Only 28% of reps get coached on a weekly cadence, the frequency associated with the strongest quota results. Source
- 92% of reps say coaching matters to their job satisfaction, and 57% call it very important. Source
- Reps receiving coaching from an external source are 50% more likely to hit quota than reps who aren’t. Source
- More than half of reps already exceeding 100% of quota say they still want more coaching than they currently get. Source
How to use this: the weekly-versus-quarterly quota gap above is one of the largest in this entire roundup, and it costs nothing to test on your own floor. Assign a short, specific practice session to every rep every week without adding hours to a manager’s calendar.
Insurance Shopping and Buyer Behavior Statistics (69-72)
- 57% of auto insurance customers actively shopped for a new policy in the year covered by the 2025 J.D. Power study, the highest rate the study has recorded in 19 years. Source
- Auto insurance premiums have climbed 78% over the past ten years. Source
- 72% of insurance buyers begin their research online, and 68% compare more than one policy before ever speaking with an advisor. Source
- The online insurance aggregator market reached $28 billion in 2025 and continues expanding at roughly 23% a year. Source
How to use this: a customer who has already compared two or three quotes before the phone rings has effectively started the call ahead of the agent. Naming specific carriers early is one of the few behaviors in this dataset directly aimed at closing that gap.
Knowledge Access and Information-Search Statistics (74-75)
- McKinsey Global Institute research puts the share of a knowledge worker’s week spent searching for and gathering information at roughly 19%. Source
- Separate IDC research found knowledge workers locate the information they’re looking for only about 56% of the time they search for it. Source
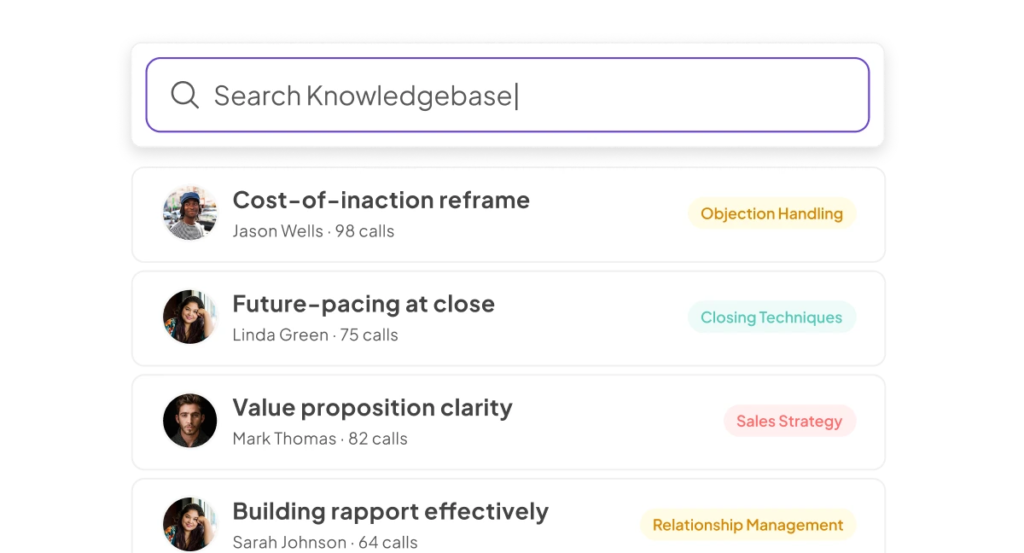
How to use this: a rep who can’t find the right answer mid-call is living out these statistics in real time, usually while a customer waits. Use your AI knowledge base to surfacesanswers from your own company and product content during the call itself, rather than sending a rep hunting through five different tools.
Where the Category Is Headed (80-83)
- Contact centers are actively consolidating vendors: teams running separate tools for QA, coaching, live assist, and knowledge management report losing value to integration overhead and disconnected data, not just licensing cost. Source
- AI voice agents are beginning to handle live customer calls directly rather than only analyzing them after the fact, a shift still young enough that no vendor in the category has mature analytics covering both human and AI-handled calls. Source
- The line between post-call scoring and real-time, in-call guidance is blurring, with several vendors now combining the two rather than treating them as separate purchases. Source
- Teams of 20 to 100 reps have become the most contested segment in the category, with vendors on both the enterprise and mid-market side building products aimed specifically at that range. Source
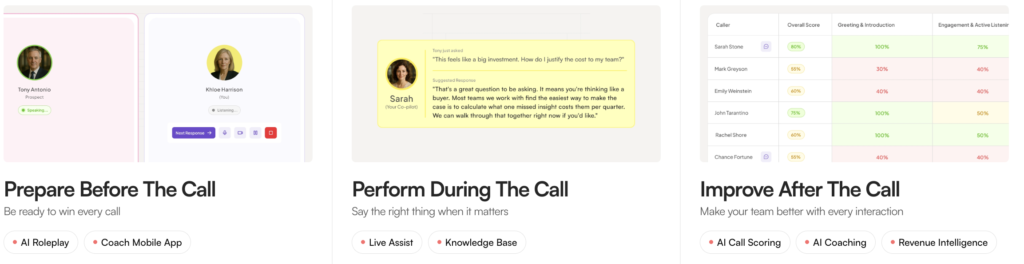
How to use this: if your team fits that 50-100 range and you’re currently stitching together separate QA, coaching, and knowledge tools, Insight7 runs all three on one shared data layer, so a gap flagged in QA turns into a coaching scenario automatically instead of a manual handoff between systems.
Every study above traces back to the same root cause: teams scoring 2-5% of their calls simply never generate enough data to publish. A 204% funnel gap or a 68% empathy gap only shows up once hundreds or thousands of conversations get scored the same way, which manual review was never built to do at that scale.
Insight7’s Call Analytics Index exists to keep publishing this kind of data as new studies complete.
To see where its own calls land against these benchmarks, start scoring your own conversations for free and compare the results directly.
FAQs About Sales Call Statistics
What percentage of sales calls result in a close?
It depends heavily on industry and deal type. Insight7’s data shows top-performing insurance agents closing 65.4% of calls, top wellness advisors enrolling 100% of patients, and top manufacturing reps placing orders on 29% of inbound calls, all against a bottom tier at or near 0% in the same conditions.
How many questions should a sales rep ask on a call?
Across 6,209 scored conversations, top-tier reps averaged 14.3 questions per call against 10.4 for average reps. The coaching benchmark drawn from that data is 12 or more per call, with density (how evenly they’re spread through the conversation) mattering as much as the raw count.
What percentage of calls do QA teams typically review?
Most manual QA programs cover under 5%, according to McKinsey research, with accuracy on those reviewed calls running 70-80%.
How often should sales reps be coached?
Weekly coaching correlates with the highest quota attainment (76%) in MySalesCoach’s 2026 research, compared to 47% for reps coached quarterly or less. Only 28% of reps currently get coached that often.