
Key points
- Across our studies, the healthy range runs from a 1:1 talk-to-listen ratio in general sales conversations to 4:1 or lower in shorter inbound insurance calls.
- One universal number does not survive contact with different call types. Your 45-minute discovery call and your 11-minute quote call reward very different speaker balances.
- Turn Balance Score measures how evenly two people trade turns, which catches a failure a percentage split hides completely. We coach to a threshold below 1.2.
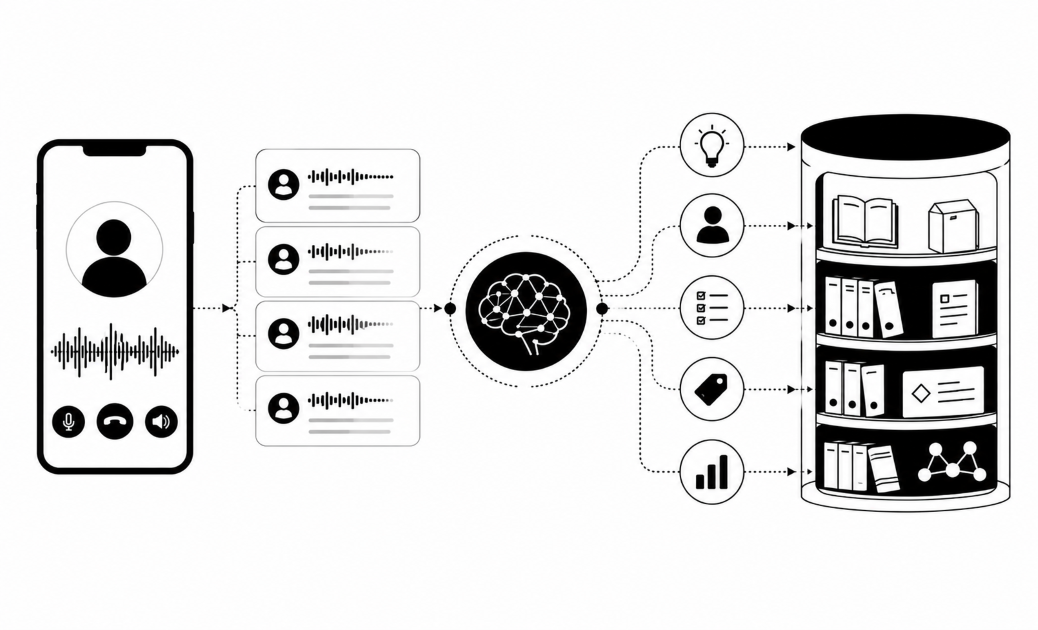
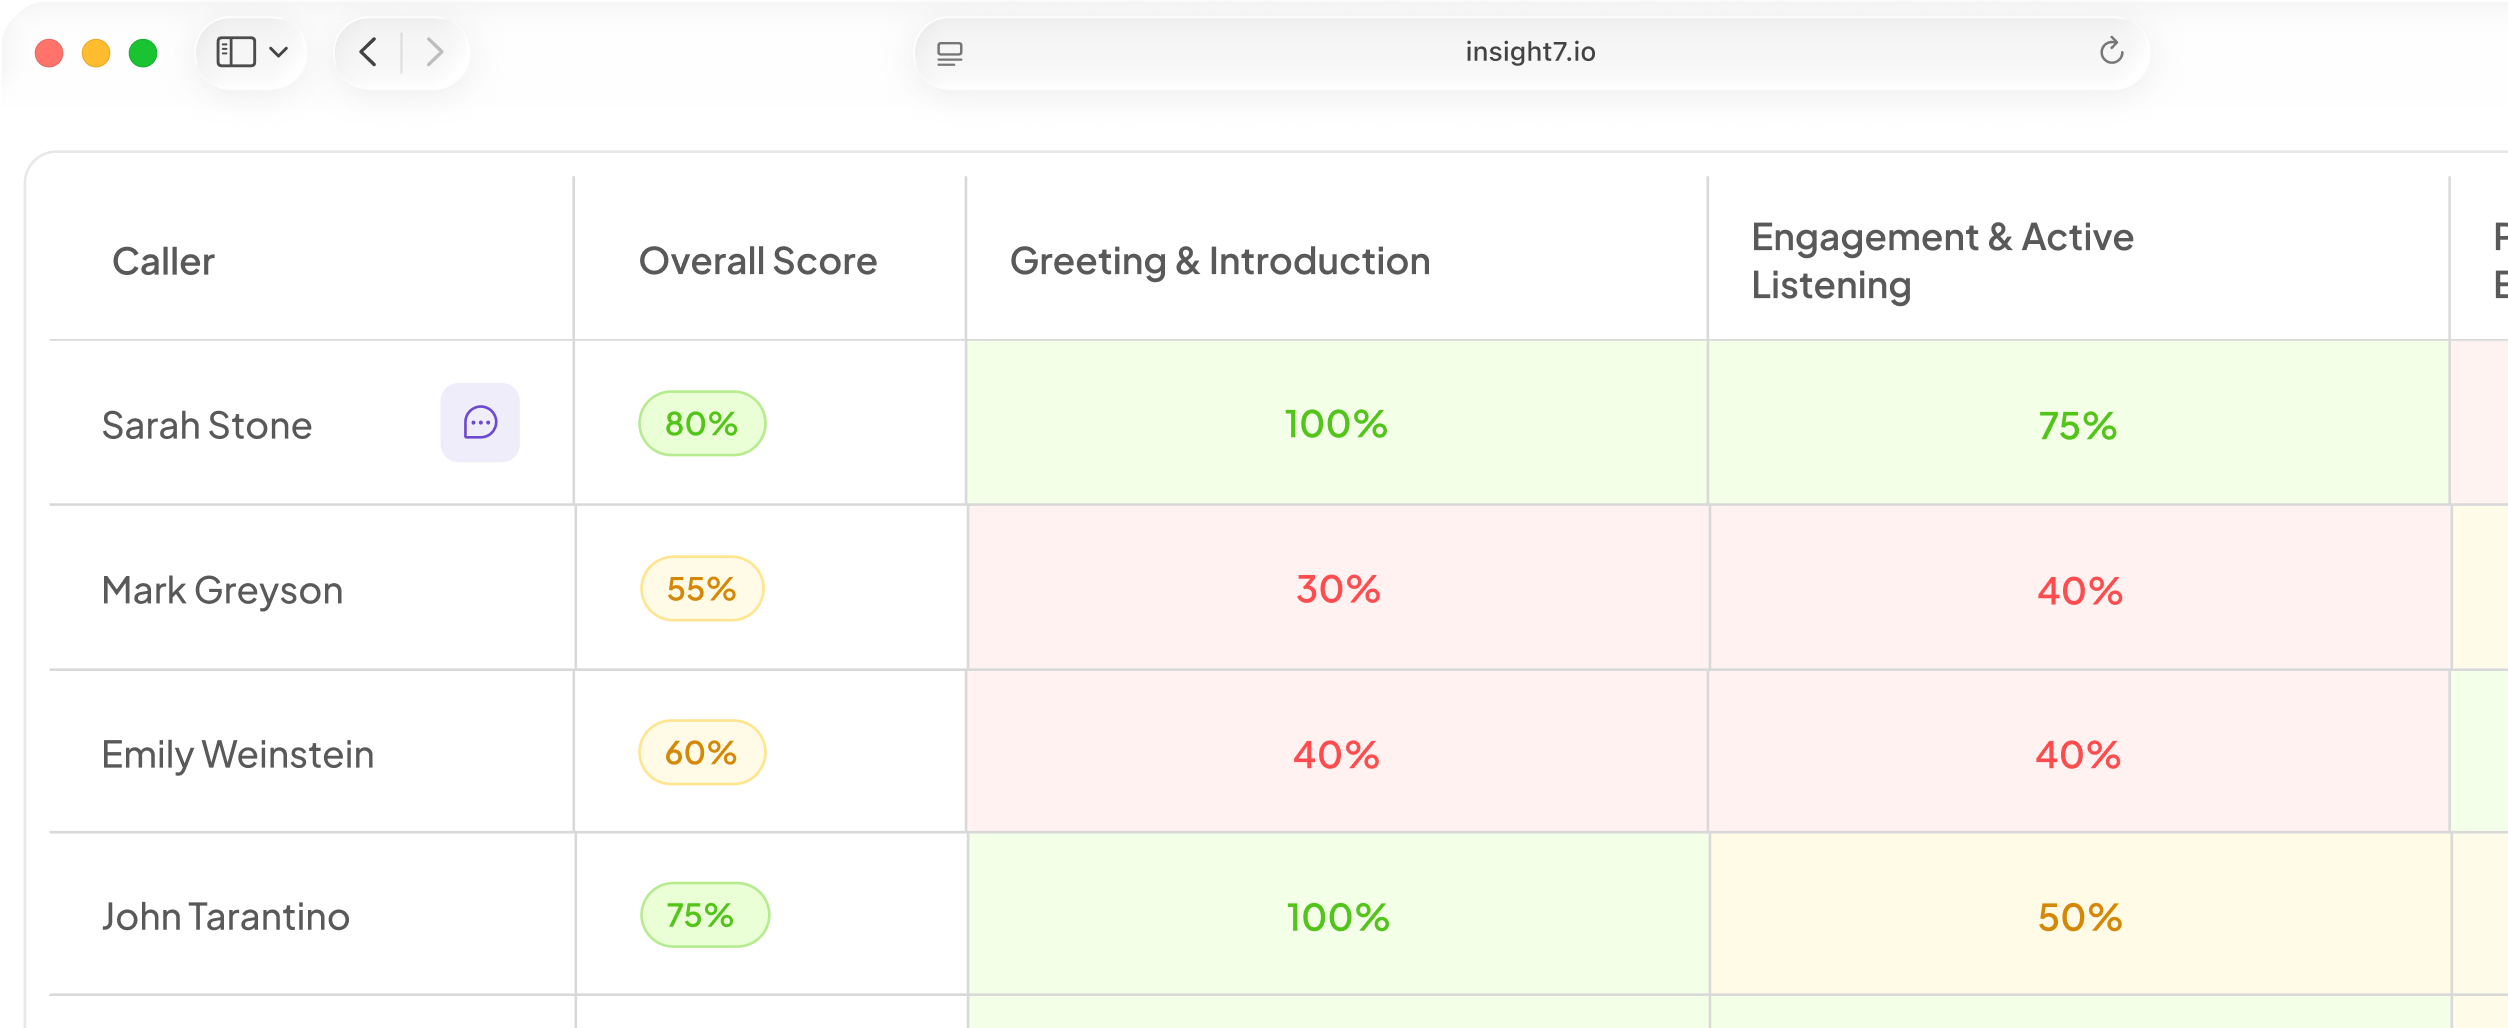
- With Insight7’s AI Call Scoring, talk ratio and Turn Balance get tracked across 100% of your calls automatically, so you can coach every rep toward these benchmarks instead of the handful you had time to review.
Ask five sales managers what a good talk-to-listen ratio is and you will get five numbers, ranging from 70/30 to 50/50, all delivered with total confidence and none of them backed by anything your reps can check.
We wanted a better answer, so we scored thousands of real conversations across four separate studies. In our study of 6,209 sales conversations, calls we rated Excellent held a 1:1 speaker dominance ratio. Calls we rated Poor ran at 1:8, with the rep doing nearly all of the talking.
Those numbers move for a reason, and the reason matters more than any single benchmark you could copy off a slide.
In this guide, we walk through the ideal talk time on a sales call by industry, explain the Turn Balance Score we use to measure it more precisely than a percentage, and show you how to work out where your own team sits.
The ideal talk-to-listen ratio across 3 real sales datasets
A good talk-to-listen ratio sits between 1:1 and 4:1 rep-to-customer, depending on how long your calls run and what the buyer came for. Here is how our three datasets compare.
| Dataset | Top-tier balance | Bottom-tier balance | Sharper secondary metric |
|---|---|---|---|
| General sales (6,209 calls) | 1:1 speaker dominance | 1:8 | Turn Balance Score 0.4 vs 1.2 |
| High-ticket insurance | 4:1 rep-to-customer | 12:1 | 16.1 vs 3.2 customer turns |
| Health and wellness | 65% or less advisor talk time | 80%+ advisor talk time | Patient participation above 35% |
The spread is wide because these conversations are doing different jobs. An insurance advisor has eleven minutes to build trust, gather coverage details, present a quote, and attempt a close, so a straight 1:1 split leaves them no room to present anything. Your discovery calls have no fixed agenda and can sit closer to even.
What stays constant is the direction. Every top tier listened more than its bottom tier, and the gap got wider as call quality dropped.
See your own team’s talk-to-listen ratio — Start scoring calls free and get the number for every rep
Talk-to-listen ratio benchmarks from a 6,209-call sales study
We scored 6,209 real sales conversations across 12 performance dimensions and sorted each one into a tier. Only 6.9% came back rated Excellent.
Speaker balance split cleanly along those tiers:
| Metric | Excellent | Poor |
|---|---|---|
| Speaker dominance ratio | 1:1 (almost equal) | 1:8 (rep dominates) |
| Turn Balance Score | 0.4 | 1.2 |
Here is what an 8:1 ratio does to your pipeline: the buyer stops volunteering anything early on, so the objection you needed to hear on the call surfaces after the proposal goes out, and budget constraint appears during procurement.
Your rep hangs up feeling good about a deal they have no evidence for, and you find out six weeks later in a forecast review.
Our CEO Odun Odubanjo put it this way:
“The top reps don’t use questions to interrogate but to guide. They don’t dominate conversations, they balance those conversations. When reps dominate, they miss what matters. When they listen, they are able to lead the conversations better.”
What Turn Balance Score measures that a percentage misses
Turn Balance Score measures how evenly two speakers trade turns across a conversation. A lower score means a more even exchange. We coach to a threshold below 1.2.
We built this metric because a raw percentage can look perfectly healthy while the conversation was anything but.
Take a 30-minute call where your rep speaks for 15 minutes and the buyer speaks for 15. On any talk-time dashboard, that is a clean 50/50 split and nobody flags it.
Now picture how those minutes were arranged. Your rep talked for 14 straight minutes, the buyer answered questions for 15, and your rep closed with a one-minute summary.
Two speakers, an even percentage, and a conversation with three turns in it.
That is why we score both. Speaker dominance ratio tells you the share of airtime, Turn Balance Score tells you whether that airtime was traded or delivered in a block. If you are an enablement lead looking at a rep whose talk percentage looks fine but whose Turn Balance sits at 1.4, you have just found something your dashboard was hiding from you.
Inside Insight7, both numbers land on the same scorecard, and you can click any score to jump to the transcript moment behind it.
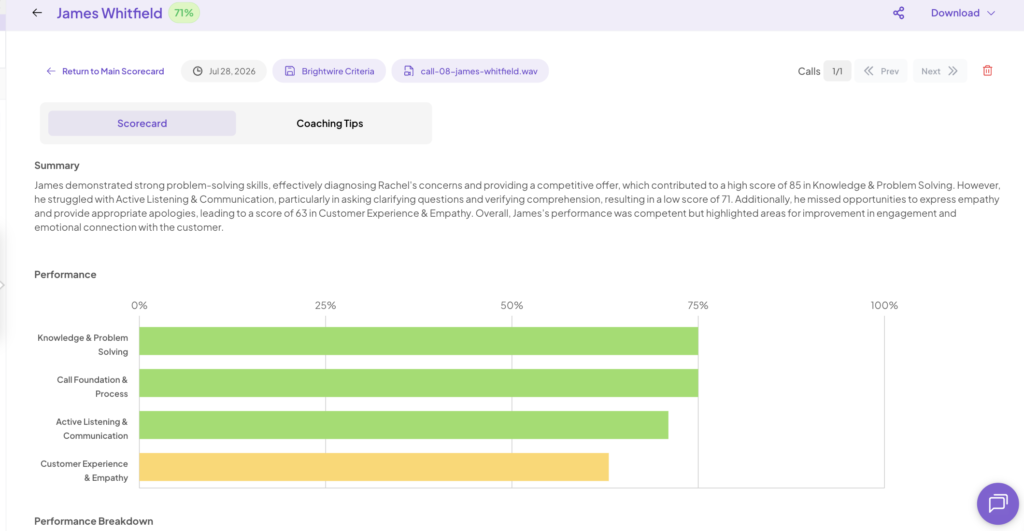
When a rep pushes back on a low balance score, you open the fourteen minutes where they were presenting and the conversation goes very differently.
Talk-to-listen ratio in high-ticket insurance sales: 4:1 vs 12:1
We also scored hundreds of insurance sales conversations. Each one a customer who requested a quote through an online comparison tool and got connected to a licensed advisor. Agents in the top 25% bound policies on 65.4% of their conversations. Agents in the bottom 25% bound none at all.
Talk ratio tracked that split closely. As we put it in the report:
“A 4:1 agent-to-customer ratio still reads as a conversation, whereas the 12:1 ratio common in bottom-tier calls is a monologue the customer is waiting politely to escape.”
The customer side of that measurement is even sharper. Top-tier conversations averaged 16.1 customer turns. Bottom-tier conversations averaged 3.2, a fivefold participation gap.
Think about what three turns covers. The customer confirms their name, answers one qualifying question, and says they will think about it. That is the whole conversation.
The number that should worry you most
The team-wide average in that study was 6.7:1 against a target of 4:1 or lower.
That average is the figure we would put in front of a sales director, because it tells you the problem sits in the middle of your team rather than at the bottom.
If you have assumed your talk-ratio issue belongs to the two agents you already worry about, you are looking at the wrong half of the roster, and your coaching hours are going to the people least able to use them.
Customer acquisition in this market runs between $500 and $900 before an advisor says a word. At 12:1, that money buys a monologue.
Advisor talk time benchmarks in wellness consultations
Wellness consultations use a talk-time percentage rather than a ratio, because the conversation is a consultation rather than a pitch.
We scored hundreds of these calls covering cellular regeneration programmes, bloodwork reviews, and precision health protocols. What we found:
- Advisor talk time target: 65% or below. Bottom-tier consultations ran past 80%.
- Patient participation: above 35%. Enrollment rates climb once patients cross that line.
- Enrollment outcome: 100% versus 33%. Top-tier advisors enrolled every patient they spoke with. Bottom-tier advisors enrolled a third, working the same programmes, the same pricing, and the same patient pipeline.
An 80% monologue fails hardest in a category where trust decides the purchase. Your patient is weighing a multi-thousand-dollar protocol and evaluating the advisor as much as the programme. An advisor who talks for four fifths of the call has given them nothing to evaluate except a script.
The behavioural fix in the top tier was small. Those advisors paused after each clinical explanation and invited a response, which produced a 36% higher emotional connection score, because their recommendations referenced the patient’s own bloodwork rather than the brochure.
If you run a practice, advisor talk time is one of the few quality signals you can catch without listening to anything.
Our AI Call Scoring evaluates every consultation against criteria you define and flags any one that crosses your 65% line, so a patient coordinator drifting toward 80% gets caught in week two instead of at the quarterly review.
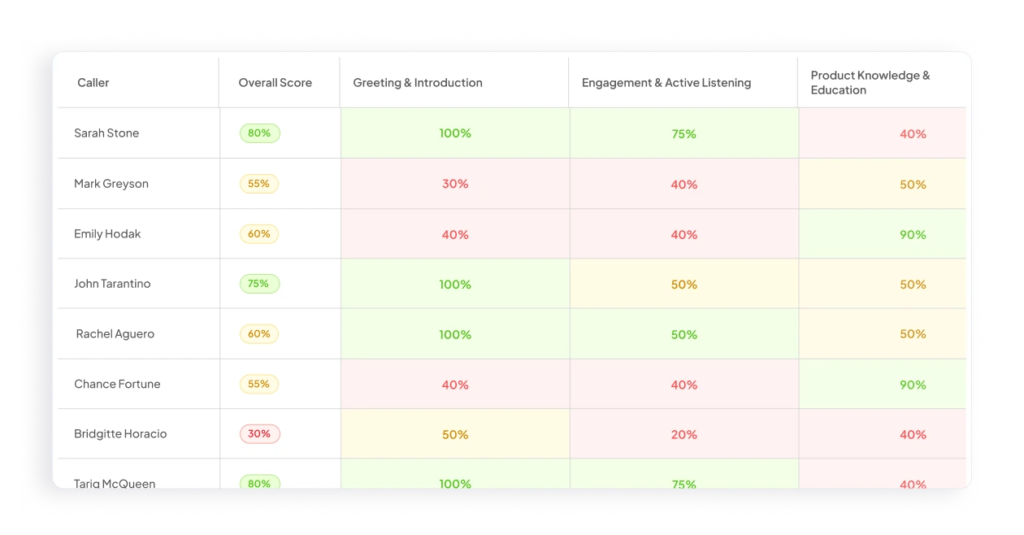
You can import a rubric you already use or build one from scratch.
Why manufacturing sales calls don’t fit the same talk-ratio benchmark
When we scored hundreds of inbound calls at a building materials manufacturer, talk ratio was not the metric that separated the tiers. It was Ddscovery completion.
| Behaviour | Top tier | Bottom tier |
|---|---|---|
| Ran project discovery | 88% of calls | 20% of calls |
| Quoted pricing on the call | 33% | 0% |
| Placed an order | 29% | 0% |
On an inbound quote call, your customer already knows what they want and picked up the phone to get a price. Talk share matters less than whether your rep asked anything at all before quoting, and bottom-tier reps skipped discovery on four out of five calls.
The underlying behaviour is the same one talk ratio measures everywhere else: a rep running discovery is trading turns with the customer or onw who takes the specification and quotes has run a transaction. We measure it as a discovery completion rate here because that is the sharper signal in this context.
Tri County Metals hit the visibility side of this problem hard. They had more than 5,100 inbound calls a month sitting on local servers across multiple locations, which meant nobody could see rep-level patterns at all.
After we moved that call data into a unified cloud platform with automated scoring, their sales leaders halved their review time and reached 100% call coverage. That coverage is what made the discovery gap visible in the first place.
How to calculate your sales team’s talk-to-listen ratio and turn balance score
You can work out the talk-to-listen ratio for a single call by hand in about ten minutes.
Here is the manual method:
- Open the recording with a transcript that has speaker labels and timestamps.
- Add up every second your rep speaks. Add up every second the customer speaks.
- Divide rep seconds by customer seconds. A rep speaking 480 seconds against a customer’s 120 gives you 4:1.
- For talk time percentage, divide rep seconds by total call seconds. 480 out of 600 gives you 80%.
- Count the turns. Every switch from one speaker to the other counts as one. Fewer than ten turns in a 30-minute call means somebody was presenting.
That works fine for one call. It falls apart at volume, which is where your actual problem lives.
If you have a QA lead reviewing ten calls a week across 40 reps, you are sampling under 2% of your conversations. That is the coverage rate we found across insurance, wellness, and manufacturing operations alike.
At that sample size, a fivefold participation gap is statistically invisible. And your sample is not even random. You listen to calls that got flagged, calls from reps you were already worried about, and calls short enough to fit between meetings.
Three things automated scoring catches that your spot-check cannot:
- Drift over time. A rep whose ratio moves from 3:1 to 7:1 across a quarter looks fine on any single call you pull.
- Call-type variation. The same rep might balance discovery calls well and dominate renewals, which a mixed sample averages into meaninglessness.
- Turn structure. Counting turns by hand across hundreds of calls is not work anyone sustains past week two.
This is where we would point you at Insight7. We connect to Zoom, Teams, Google Meet, and telephony systems like Aircall, RingCentral, and Five9, so calls import as they happen.
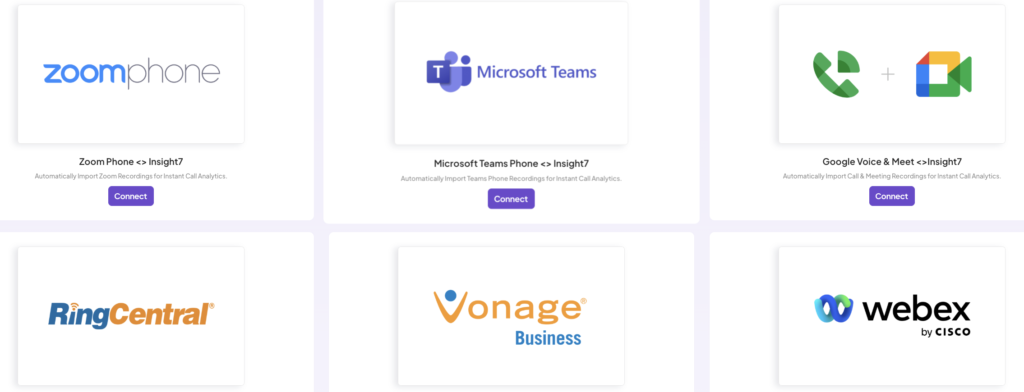
Every one gets scored against the criteria you set for that call type, and talk ratio, turn count, and balance score land on the rep’s scorecard automatically.
The part that matters for adoption is what happens next. A low balance score generates a specific coaching plan, and your rep can practise against an AI buyer in AI Roleplays before their next live call.
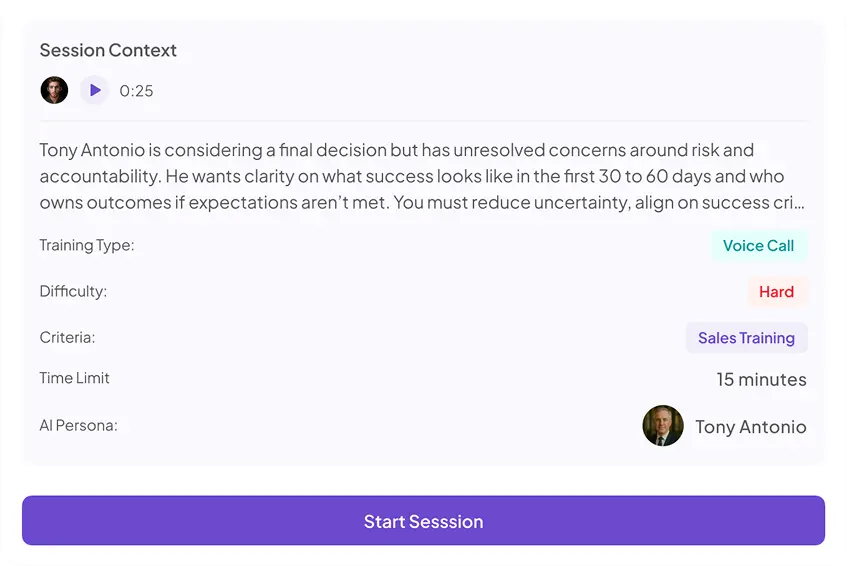
Reading a number on a dashboard changes nothing. Running the conversation again with the pacing corrected is what moves the ratio.
Want to test one call before committing to anything? Our free Call Quality Monitor takes an audio file or transcript and hands back a scorecard, no setup required.
Fix your talk ratio with AI Call Scoring
The benchmark that fits your team depends on what your calls are for. General sales conversations reward a 1:1 balance with Turn Balance below 1.2. Shorter inbound calls work at 4:1 or lower. Consultations should keep the advisor at or under 65% of talk time.
Before you set any target, find out where your team sits right now. Pull one call from your strongest rep and one from someone struggling, run the manual calculation on both, and compare. If the gap looks anything like 4:1 against 12:1, you have found your first coaching priority.
Upload five calls and we will score the ratio, the turn count, and the balance for you FREE.
FAQs about good talk-to-listen ratio
What is a good talk-to-listen ratio for a sales call?
A good talk-to-listen ratio falls between 1:1 and 4:1 rep-to-customer, depending on the call. In our study of 6,209 sales conversations, calls rated Excellent held a 1:1 speaker dominance ratio while calls rated Poor ran at 1:8. In shorter insurance quote calls, top-tier agents ran at 4:1 against 12:1 for bottom-tier agents.
What is a turn balance score?
Turn Balance Score measures how evenly two speakers trade turns in a conversation, with a lower score meaning a more even exchange. Calls rated Excellent in our study scored 0.4 while calls rated Poor scored 1.2, and we coach to a threshold below 1.2.
It catches conversations where the talk-time percentage looks balanced but one person delivered their whole share in a single uninterrupted block.
Does the ideal talk ratio change by industry or deal size?
Yes, and meaningfully. Our three datasets produced three different benchmarks: 1:1 for general sales conversations, 4:1 or lower for high-ticket insurance calls, and 65% or less advisor talk time for wellness consultations.
Manufacturing inbound calls turned on discovery completion instead, with top reps running discovery on 88% of calls against 20% for bottom reps.
How do I calculate my own talk-to-listen ratio?
Take a transcript with speaker labels and timestamps, total the seconds each party speaks, then divide rep seconds by customer seconds. For talk time percentage, divide rep seconds by total call seconds. Count speaker switches to get your turn count.
This works for a single call, though manual review across a full team typically covers under 2% of conversations, which is too small a sample to spot drift or pin a pattern on a specific rep.