
A customer fills in a comparison form at ten in the evening, gets routed to a licensed advisor, and spends eleven minutes on the phone. Whether that call ends with a bound policy depends far more on who picked up than on anything the customer brought to it.
We scored hundreds of insurance sales conversations on our conversation intelligence platform, every one of them a customer who started a quote through an online comparison tool and connected with a licensed advisor.
Agents in the top 25% bound policies on 65.4% of their conversations while agents in the bottom 25% bound zero. Identical products, lead source and tooling.
Everything below is what the recordings showed about how the two groups spend those eleven minutes differently, along with the five daily targets we would coach to first.
Methodology
Sample: hundreds of insurance sales conversations, scored on Insight7’s conversation intelligence software. All calls involved customers who requested a quote via an online comparison tool and connected with a licensed advisor.
Scoring: each conversation graded 1 to 10 across five dimensions, mapped to a four-stage customer journey of Engage, Discover, Quote, Close. The dimensions are Funnel Performance, Discovery and Engagement, Time Management, Compliance and Product, and Objection Handling.
Tiers: conversations grouped by weighted composite score into top 25%, middle 50%, and bottom 25%.
What this measures: whether the agent executed the behavioural sequence that moves a customer from quote to bound policy, rather than whether particular words appeared in the call. Every score comes from a recorded conversation.
Insurance sales close rate benchmarks at a glance
| Metric | Top tier | Bottom tier | Gap |
|---|---|---|---|
| Close rate | 65.4% | 0% | Total |
| Funnel Performance | Completes all 4 stages | Stalls before quoting | 204% |
| Questions per conversation | 7 (around 2 open-ended) | 3 (fewer than 1 open-ended) | 111% |
| Customer turns per conversation | 16.1 | 3.2 | 5x |
| Agent-to-customer talk ratio | 4:1 | 12:1 | 3x |
| Carriers named per conversation | 1.69 | 0.12 | 108% |
Every figure below comes from that scoring.
The market these conversations happen in
Insurance sales performance carries a cost structure that makes a poor conversation more expensive than it looks. Acquiring a single customer and getting them onto a call runs between $500 and $900 before an agent says a word, so a bottom-tier conversation that closes nothing has already spent that money.
Two things have made the conversation itself harder to win.
Auto insurance premiums climbed 78% over a decade, and price-sensitive customers responded by shopping far more aggressively. J.D. Power’s 2025 U.S. Insurance Shopping Study found that 57% of auto insurance customers actively shopped for a new policy in the previous year, up from 49%, and the highest rate recorded in the study’s 19-year history. That figure has since eased slightly.
J.D. Power’s 2026 study puts the shopping rate at 53%, still well above historical norms, with nearly half of all new auto policies now purchased through digital channels.
The second shift is what the customer already has open when the phone rings. Around 72% of buyers begin their search online and 68% compare multiple policies before speaking to anyone, feeding an aggregator market that reached $28 billion in 2025 and continues growing at 23% annually.
By the time an advisor picks up, that customer typically has two or three competing quotes in other browser tabs, so the window to win is narrow and a weak conversation closes it for good.
Where the revenue leaks
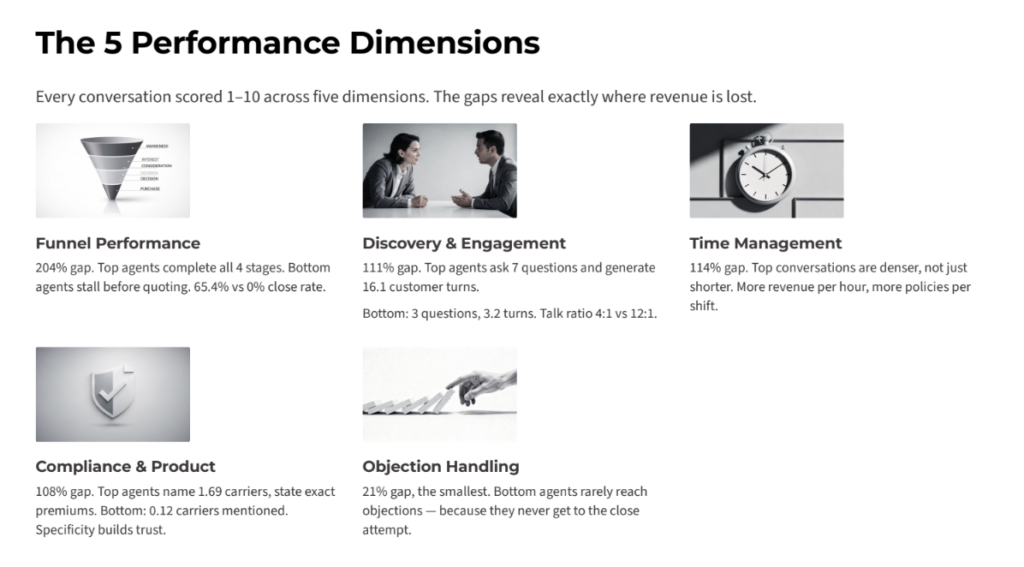
We scored every conversation across five dimensions. Ranking them by the size of the gap between top and bottom tiers shows exactly where the money goes:
| Dimension | Gap | What separated the tiers |
|---|---|---|
| Funnel Performance | 204% | Top agents complete all four stages. Bottom agents stall before quoting. |
| Time Management | 114% | Top conversations are denser, producing more revenue per hour worked. |
| Discovery and Engagement | 111% | Top agents ask 7 questions and generate 16.1 customer turns. |
| Compliance and Product | 108% | Top agents name 1.69 carriers and state exact premiums. |
| Objection Handling | 21% | The smallest gap, for a reason covered below. |
Funnel Performance: 204%
Funnel Performance measures whether an agent moves through all four stages of the conversation and makes a genuine attempt to bind. Top-tier agents send payment links proactively, confirm effective dates, and name the next step before the customer thinks to ask for it.
Bottom-tier agents stall somewhere earlier. Many never present a quote at all, and some quote without ever attempting a close, which produces the 65.4% against 0% split. Not a lower conversion rate, but nothing.
A sales director looking at a team dashboard rarely sees this, because a conversation that never reached the quote stage still logs as a completed call with a reasonable handle time.
Discovery and Engagement: 111%
Top-tier agents asked 7 questions per conversation with around 2 of them open-ended, while bottom-tier agents asked 3 with fewer than 1 open-ended. The sharper signal sits in how much the customer said back: top conversations averaged 16.1 customer turns against 3.2 in the bottom tier, a fivefold difference in participation.
Talk ratio makes the same point from the agent’s side. A 4:1 agent-to-customer ratio still reads as a conversation, whereas the 12:1 ratio common in bottom-tier calls is a monologue the customer is waiting politely to escape.
Discovery is the mechanism that turns a generic pitch into a recommendation the customer recognises as theirs. An agent who learns why someone is shopping and what coverage matters to them can build a case. An agent who learns none of that can only read prices aloud.
Compliance and Product: 108%
The size of this gap overturns something many insurance sales managers assume, which is that thorough compliant presentations slow conversion down.
Top-tier agents named 1.69 carriers per conversation, stated exact premiums, explained coverage terms, and compared alternatives directly.
Bottom-tier agents named a carrier on 0.12 conversations, meaning the overwhelming majority of their customers finished the call without learning who was behind the quote they had just been given.
Specificity is what makes a quote believable. A customer holding three competing quotes has no way to evaluate an unnamed one, so the agent who names two carriers and states the premium to the dollar is also the agent whose number gets trusted. Compliance and conversion pull in the same direction here.
Time Management: 114%
Top conversations were denser rather than shorter, covering more ground in the same minutes. The commercial consequence is measured per shift rather than per call: more policies bound in the same hours, without asking anyone to work faster.
Objection Handling: 21%
The smallest gap in the study is the most misleading number in it.
Bottom-tier conversations rarely reach the point where an objection can surface. No quote means no price pushback, and no close attempt means no stalling tactic to overcome. Objection handling is a downstream skill that only activates once discovery and funnel progression are already working.
When bottom performers appear competent on objection handling in a QA report, the likely explanation is that nothing tested them.
For a sales manager, the practical implication is uncomfortable: the objection-handling workshop booked for next quarter will do nothing for the agents who need help most, because those agents never get far enough into a call to use it.
Five metrics to coach against
These are the benchmarks drawn from the top-performing tier, with the team-wide average alongside each so the distance is visible.
| Metric | Target | Average now | What to coach |
|---|---|---|---|
| Funnel completion | 8.5/10 or above | 5.87 | Every conversation reaches all four stages and ends with a close attempt |
| Questions per call | 7+, with 2 open-ended | 5.08 | Cover shopping reason, coverage needs, and payment preference before quoting |
| Talk ratio | 4:1 or lower | 6.7:1 | Pause after every block of information and invite a response |
| Carriers mentioned | 2 or more | 1.04 | Name at least two carriers checked, because comparison builds trust |
| Time to quote | Within the first third of the call | Varies | Finish discovery early and start quoting, since a quote is what the customer came for |
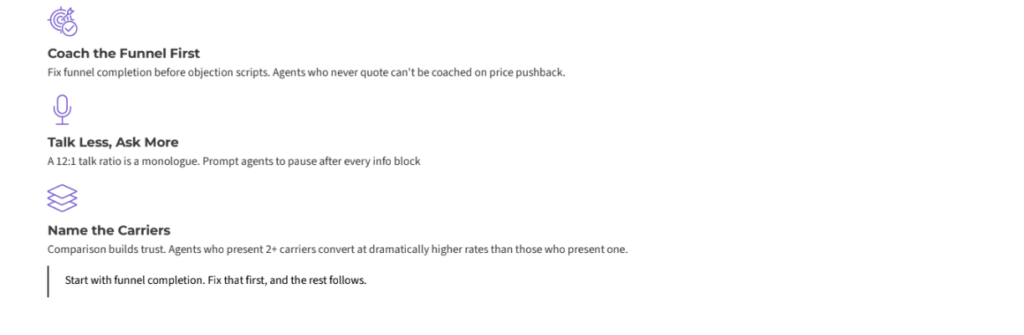
Coach funnel completion before anything else. An agent who never quotes cannot be coached on price pushback, and every downstream skill depends on the conversation reaching the stage where that skill applies.
The team average of 1.04 carriers is a useful one to sit with, because it means a typical conversation names a single carrier and moves on. Lifting that to two is a scripting change rather than a skills programme, and the 108% gap suggests it carries more weight than its difficulty implies.
Chat makes all of this harder
Voice converts at roughly twice the rate of chat, and chat is becoming the dominant channel for insurance quoting.
Tone, pacing, and the small conversational cues an experienced agent reads instinctively all disappear in text. Recovery behaves differently too: a voice call that stalls still has the customer on the line, while a chat that stalls has already lost them to the next tab.
Chat QA also tends to be more neglected than call QA, so the gap widens each quarter without anyone measuring it. The behaviours in this report, particularly funnel completion and turn balance, become the only levers an agent has once tone is gone.
Why insurance teams have not seen this data before
The behaviours above sit in recordings that insurance operations already keep. What has been missing is coverage.
Most QA teams manually review under 2% of conversations. At that sample size a 204% funnel gap and a fivefold participation gap are statistically invisible, and no human reviewer can track carrier mentions or turn counts across hundreds of agents and thousands of calls.
The pattern holds well beyond insurance. In Peru, Entel Connect Center handles more than 600,000 inbound calls a month and could previously review fewer than 1% of them, leaving supervisors coaching on intuition alone.
After moving to daily analysis of every interaction with McKinsey, QuantumBlack and Google Cloud, inbound service sales rose 40% within ten weeks and agents doubled how often they made an offer during a service call, with NPS improving from 40.3% to 41.2%.
Nothing about those agents changed except the coverage to see what they were doing.
Three things to try this week
For a sales manager or QA lead running 20 to 100 licensed agents, three of these findings can be tested without buying anything.
- Count the quotes, not the calls: Pull twenty recent conversations and mark whether each one reached a presented quote. If the share sitting below that line surprises you, funnel completion is your first coaching target and the 204% gap explains why.
- Count carrier mentions on ten recordings: The team benchmark to beat is 1.04. Getting to two is largely a matter of adding one line to how agents present a quote.
- Listen to the last ninety seconds of ten calls: Score each on whether a close was attempted, with a specific next step named. Conversations that end warmly and vaguely show up as lost to a competitor days later.
Scoring twenty calls tells you whether a problem exists. But scoring every call lets you know what agent has it, which is the point at which insurance sales coaching stops being an annual workshop and becomes a weekly routine.
The complete High-Ticket Insurance Sales report covers all five dimensions with tier-by-tier benchmarks and the full coaching playbook.
Download the report or score your own conversations by uploading five recordings.
Cite this research: Insight7. High-Ticket Insurance Sales: How to Improve Conversions at Scale. 2026. https://insight7.io/high-ticket-insurance-sales-convert-more-at-scale/
Media and analyst enquiries: hello@insight7.io
Frequently asked questions
What is a good close rate for insurance sales?
In Insight7’s study of scored insurance sales conversations, top-tier agents bound policies on 65.4% of conversations while bottom-tier agents bound none, working the same lead source and products. The gap traces to funnel completion rather than product or market conditions.
How many questions should an insurance agent ask before quoting?
Top-tier agents asked 7 questions per conversation with around 2 open-ended. The team average was 5.08, and the coaching target drawn from top performers is 7 or more.
What is the ideal talk ratio on an insurance sales call?
Top-tier conversations ran at roughly 4:1 agent to customer, against 12:1 in the bottom tier. Top conversations also generated 16.1 customer turns compared with 3.2.
Does naming multiple carriers help or hurt conversion?
Top-tier agents named 1.69 carriers per conversation against 0.12 for bottom-tier agents, a 108% gap. Comparison and specific premium figures both correlated with higher binding rates.
How much does a lost insurance sales conversation cost?
Customer acquisition in this market runs between $500 and $900 before an agent speaks, so a conversation that ends without a close attempt has already spent that amount.