
Manufacturing Sales Quote-to-Close Gap : What Hundreds of Building Materials Sales Calls Reveal
Across hundreds of scored inbound calls, 43% were quote requests and only 26% produced a price while the customer was still on the phone.
Health Coaching Consultation Conversion Rates: Benchmarks From Scored Patient Calls
Bottom-tier wellness consultations run at 80% or more advisor talk time. Enrollment rates rise when the patient speaks for a third of the conversation. Here are the benchmarks behind that, and six more.
Insurance Sales Close Rate Benchmarks: 65% vs 0% on Identical Leads

Objection handling produced the smallest gap in our insurance study, at 21%. The reason has nothing to do with bottom-tier agents being good at it, and it explains why most objection training misses the agents who need help most.
Sales Rep Performance Metrics: 12 Benchmarks From 6,209 Scored Calls
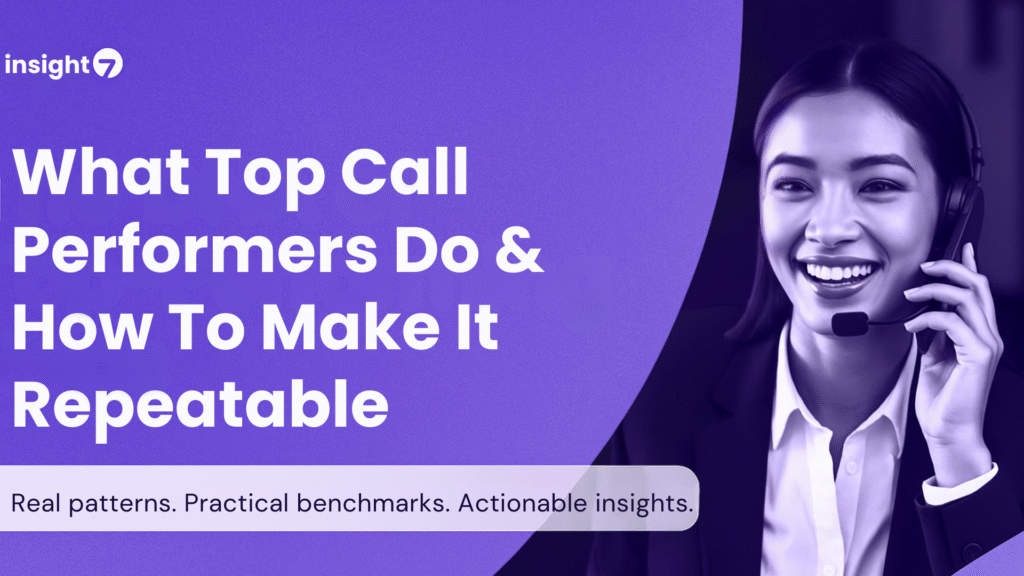
Every sales manager can name their top rep but very few can explain what that rep does on a call that the others do not. That gap is where coaching stalls. A manager who knows Sarah is the best closer but cannot describe the mechanics of her calls ends up coaching everyone toward “be more like Sarah,” which is a personality instruction rather than a behavior anyone can practice. We built the Call Analytics Index to close that gap with numbers. This first study scored 6,209 real sales conversations across 12 dimensions on Insight7’s call evaluation platform. Of those, 427 rated Excellent. That is 6.9%. What follows publishes every figure from the study, along with the sales rep performance metrics you can set as targets this week. The behaviors that separated the top tier are specific, measurable, and teachable. How the conversations were scored The method matters before the numbers mean anything. Each of the 6,209 conversations was evaluated on Insight7 against 12 scoring dimensions, then assigned to a performance tier based on its composite score. Every score reflects a real recorded conversation rather than a survey response, a self-assessment, or a modeled estimate. The 12 dimensions scored: Six of those need definitions, because the terms carry specific meanings in this dataset: Naming these dimensions is what makes the findings usable. A manager who tells a rep to “build better rapport” has given feedback nobody can act on. But saying the rep scored 2.8 on empathy and rapport, and pointing to the moment in the transcript where a customer concern went unacknowledged = giving that rep something to fix. How 6,209 conversations sorted into tiers The 6,209 conversations sorted into four tiers: Tier Conversations Share Excellent 427 6.9% Good 1,238 19.9% Average 3,979 64.1% Poor 565 9.1% Two-thirds of every conversation scored landed in the Average band. For a sales leader running 40 reps, that distribution means roughly 26 of them are producing conversations that are competent and unremarkable, while the coaching calendar treats them as one undifferentiated group. The 565 Poor conversations are the ones a QA sample is most likely to miss. At a 2% review rate, a team scoring 6,209 conversations a quarter would review around 124 of them, and fewer than 12 of those would statistically come from the Poor tier. The weakest performance in the operation is also the least likely to be seen. What separated the top 6.9% We compared the 427 Excellent conversations against every other tier. Four behavioral patterns showed up consistently, and each one can be measured on a call and coached the following week. 1. They asked more questions and asked them faster Metric Excellent Average Delta Questions per call 14.3 10.4 +37% Question density (per minute) 1.2 0.6 2x Top performers in the Insight7 dataset asked 14.3 questions per call against 10.4 for average performers, a 37% difference. The density figure is the sharper one. At 1.2 questions per minute against 0.6, top reps asked twice as often within the same span of time, which means their questions were distributed through the call rather than clustered into an opening discovery block. That distribution pattern is what makes the behavior coachable. A rep who front-loads ten questions and then presents for twenty minutes has run a qualification script. A rep who keeps asking at a steady rate is checking their understanding as the conversation develops, and that is where the timing advantage comes from. The Excellent tier asked key qualifiers before offering solutions rather than after. For an enablement lead at a 60-rep SaaS company, this is the easiest of the four to instrument. Question count per call is a countable event. Set a floor, report it weekly, and the number moves. 2. They shared the floor Metric Excellent Poor Speaker dominance ratio 1:1 (almost equal) 1:8 (rep dominates) Turn Balance Score 0.4 1.2 The standard coaching instruction to take control of the conversation runs against what the data shows. Excellent conversations held an almost equal speaker dominance ratio. Poor conversations ran 1:8 in the rep’s favor. A 1:8 ratio on a 30-minute call leaves the customer with under four minutes of speaking time. Objections, budget signals, and competing priorities all live in those four minutes, and a rep talking through them collects none of it. Balanced talk time reduces defensiveness and gives the rep the material to personalize a recommendation, which is why the top tier listened early and led later. Turn Balance Score is the cleaner metric to coach against, because it produces a single threshold. Below 1.2 is a conversation. Above it is a presentation the customer is waiting out. 3. They closed with a defined next step Metric Excellent Average Delta Actionable Outcomes 4.8 3.3 +45% Information Density +27% baseline 27% High-performing reps in the dataset scored 4.8 on Actionable Outcomes against 3.3 for average performers, a 45% gap. Excellent conversations ended with the next step named out loud rather than implied. The Information Density figure sits alongside it for a reason. Top conversations carried 27% more meaningful information in the same span, so the clarity was not coming from talking longer. A call that ends with “I’ll send the security documentation by Thursday and we’ll reconvene Monday with your CTO” has done something a call ending with “I’ll get back to you” missed. For a sales manager reviewing pipeline, this behavior shows up as deal velocity. Every conversation without a defined next step becomes a follow-up sequence, and follow-up sequences are where deals go quiet. 4. They scored higher on empathy than on anything else Metric Excellent Poor Delta Empathy & Rapport 4.7 2.8 +68% Enthusiasm Score +35% baseline +35% Exclamation count 2.4x baseline 2.4x Empathy and rapport produced the widest single behavioral gap in the study at 68%, wider than question count, wider than talk balance, wider than outcome clarity. That tends to surprise sales leaders who treat empathy as a personality trait rather than a scorable behavior. In this dataset it was
