

Most managers are working off assumptions. Who’s improving and who’s falling behind. And that assumption is usually right – until it isn’t. Until someone who seemed fine turns out to have been struggling for months, and you only find out because something went wrong.
That’s a visibility problem.
Your Team’s Training, All In One Place
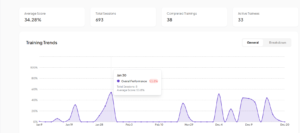
The Training Intelligence Dashboard sits right on your home screen, showing you exactly what’s happening with your team’s training before you’ve done anything else. Total sessions completed, average scores across the team, how many training sessions have been finished and how many are still pending. All of it, without pulling a single report.
Tracking Individual Performance
This is where it gets interesting.
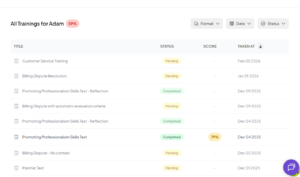
The performance table shows you every person on your team alongside their completed training, their average score, and how much their score has improved since they started.
That improvement column is the one that changes how you coach. Because a rep sitting at 51% who has improved 39% is telling you something completely different from someone sitting at 60% who hasn’t moved in weeks. One of them is growing. The other needs attention. The dashboard makes that distinction clear so you’re not left trying to piece it together yourself.
And if you want to go deeper on anyone, click into their profile and see every training they’ve taken – the score, the status of each session, and when they took it. The complete picture, one click away.
Filtering To What You Need
Filter by role or by date and get straight to what’s relevant – without digging through information that doesn’t apply to what you’re trying to solve right now.
Spotting Trends Across Your Team
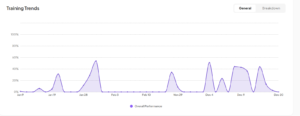
The training trends chart tracks how performance moves over time. Not just where your team is today, but the direction they’re heading.
Switch to the breakdown view and you can track performance across specific training types – what’s driving real improvement and what isn’t landing the way you expected. These are the patterns that take weeks to surface manually. On the dashboard, they’re immediately visible.
Visibility changes everything. When you can see exactly where your team stands and where they’re heading, you stop reacting to problems after they’ve compounded – and start addressing them before they do.


