
A rep who wants to avoid a hard call rarely says so out loud. They let their phone ring a beat longer before picking up, clip their sentences short and find a reason to transfer a customer who called about something they’re fully trained to handle.
None of this shows up on a standard dashboard built around average handle time and calls per hour, because those numbers reward exactly the behavior a call-avoidant agent is already doing.
Here are seven tactics agents use to avoid engaging with difficult calls, and the specific signals in call data that expose each one.
Why CX Agents Avoid Calls
Call avoidance is any deliberate agent behavior that reduces the number of customer interactions they handle, or shortens those interactions, without resolving the customer’s issue.
The important word is deliberate. An agent who transfers a technical billing question to the right team is doing their job. One who transfers every call that arrives after 4pm is avoiding work, and the two look identical in a transfer report.
That ambiguity is why call avoidance survives so long. Every instance has a plausible explanation, and the pattern only appears when you can see hundreds of calls from the same agent side by side.
Agent utilization is the strongest structural predictor of why this happens. Someone at 90% utilization across an eight-hour shift gets roughly 48 minutes of non-call time to cover breaks, after-call work, and any recovery between a furious customer and the next one. Avoidance appears where that recovery time disappeared.
Metric design contributes as well. A team measured hard on average handle time learns that a fast call scores better than a resolved one.
Check this first: pull utilization for whichever agents show the strongest avoidance signals. If they are your highest-volume people, you might be looking at a workload problem.
7 Call Avoidance Tactics and the Data Signals That Reveal Them
Some of these are obvious once you know what to look for. Others hide behind a legitimate explanation, which is why each one comes with the signal that separates a genuine case from a pattern.
1. Abrupt Call Termination and Early Hang-Ups
The agent disconnects before the customer has finished, sometimes mid-sentence, and the ACD logs it as a completed call.
How to spot it in your data: look for disconnects where the agent side ended the connection while the customer was still speaking. Speaker diarization makes this visible, since the transcript shows the customer’s turn cut off rather than closed.
Cross-reference thus against repeat contacts from the same number within 24 hours, because a customer whose call dropped almost always rings back.
One instance might mean a bad connection but fifteen from the same agent in a month, clustered in the last hour of shift, is a pattern.
2. Short-Call Abuse and Sub-30-Second Disconnects
These include calls answered and ended fast enough that no real conversation took place. Answering and immediately disconnecting registers as a handled call and improves an agent’s volume statistics.
How to spot it in your data: filter for calls under 30 seconds and look at the distribution rather than the average. Any agent has a small tail of genuine wrong numbers, while an avoiding agent has a cluster that usually correlates with queue depth.
Signal to track: short calls as a percentage of total handled, by agent, week over week.
3. Extended Holds That End in Customer Abandonment
The agent places the customer on hold and leaves them there until they give up. Your reporting records the disconnect as customer-initiated, which moves responsibility somewhere convenient.
How to spot it in your data: measure hold duration immediately before customer-side disconnects, then compare each agent’s average against the floor. Repeated short holds inside a single call point to stalling rather than research.
4. Unnecessary Transfers and Escalation Dumping
This is the hardest tactic to catch from routing data, since a transfer report cannot tell you whether the transfer was warranted.
How to spot it in your data: the answer sits in the conversation rather than the routing log.
Did the agent attempt the documented troubleshooting steps, and did they ask the qualifying questions? Your AI call scoring tool can evaluate the transfer decision as a scored criterion, which turns a subjective judgment into something reviewable.
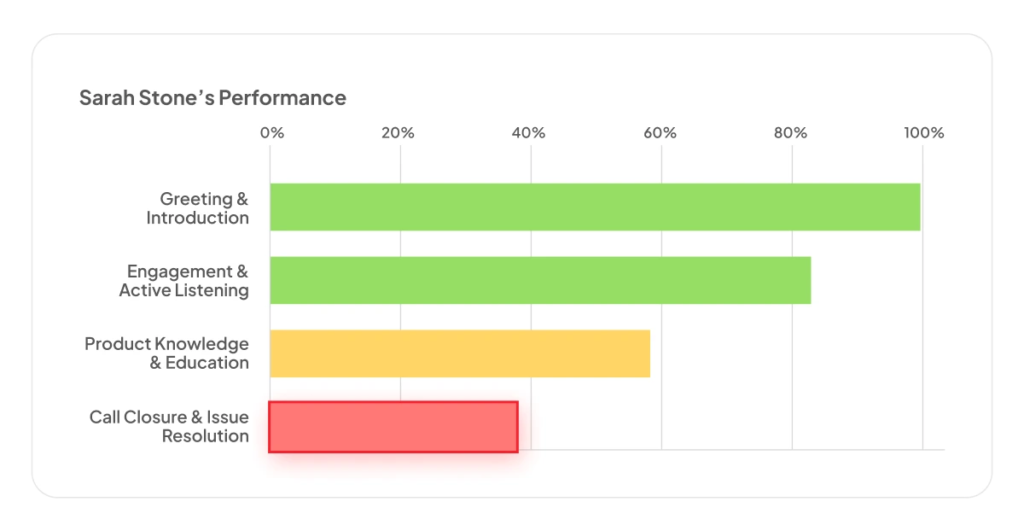
Signal to track: transfer rate by agent, filtered to call types they are authorized to handle end to end.
5. Aux Code Misuse and Extended Not-Ready Status
Agents stay in an unavailable state longer than the work requires, or select an aux code that does not match what they are doing.
How to spot it in your data: compare aux time against the tasks each code represents, then check the timing. Avoidance-driven aux time spikes when queue volume rises rather than distributing evenly across a shift.
6. Deliberate Disengagement During Live Calls
The agent stays on the line and stops participating, letting silences stretch and answering in monosyllables until the customer ends the call themselves.
How to spot it in your data: talk ratio paired with silence detection. Our analysis of 6,209 scored conversations found top performers hold a balanced 1:1 speaker ratio, while weak calls collapse into one-sided exchanges.
Disengagement leaves a distinctive signature where the agent’s share of talk time drops well below normal and dead air between turns repeatedly stretches past a few seconds.
Signal to track: agent talk ratio below 25%, combined with three or more silences exceeding five seconds in a single call.
7. Inflated After-Call Work and Wrap-Up Time
This includes wrap-up time expanded to delay the next arriving call, which holds an agent out of the queue while looking productive.
How to spot it in your data: compare wrap duration against call complexity. A three-minute password reset generating six minutes of wrap-up is a signal. Benchmark each agent against their own averages on similar call types rather than against the team, since call mix varies by skill group.
How to Detect Call Avoidance in Your Contact Center Data
On its own, none of these signals proves anything, since any agent can have a slow week or a genuinely difficult call. Avoidance shows up as the same signal recurring across several weeks and clustering around predictable conditions.
Filter each signal by:
- Queue depth. Avoidance rises when the queue gets long, because that is when the incentive appears.
- Time of shift. The final hour concentrates most of it.
- Call type. Complaints, disputes, and cancellations attract more avoidance than routine inquiries.
A practical starting point: take one agent you have concerns about and one strong performer, pull 20 calls from each, and compare the seven signals side by side. The contrast is usually obvious, and it gives you a baseline for what normal looks like before you score anybody else.
Unfortunately, manual QA reviews under 2% of interactions in most operations. That sample size cannot detect a behavioral pattern, and the sampling method makes it worse.
Reviewers also select which calls to score, and human selection carries assumptions with it. Anything that looks uneventful gets passed over, and a 22-second disconnect containing no conversation reads as uneventful. So the calls holding your clearest evidence are the ones least likely to be reviewed.
When Tri County Metals moved from spot-checking to scoring all 5,100 of their monthly inbound calls, the value came from patterns that only appear at full coverage.
Insight7 has transformed the way we approach customer service. The ability to grade and analyze our calls at scale provides clarity we didn’t have before. It’s not just about the data; it’s about what the data tells us about our customers and opportunities.
Brent, IT Manager, Tri-County Metals
How to Address Call Avoidance Without Increasing It
A meta-analysis in Computers in Human Behavior Reports, covering 70 independent samples, found that electronic monitoring is associated with an increase in counterproductive work behavior, alongside slightly lower job satisfaction and higher stress.
Monitoring implemented as surveillance produces more of the behavior you deployed it to catch. Agents who experience scoring as a hunt for reasons to discipline them get better at avoiding detection, which leaves you worse off than when you started.
These four things separate the rollouts that hold:
- State the purpose in writing before launch. Scores feed coaching. Say so, and mean it.
- Give agents their own scorecards directly rather than filtering everything through a manager, so the data is something they can act on rather than something being said about them elsewhere.
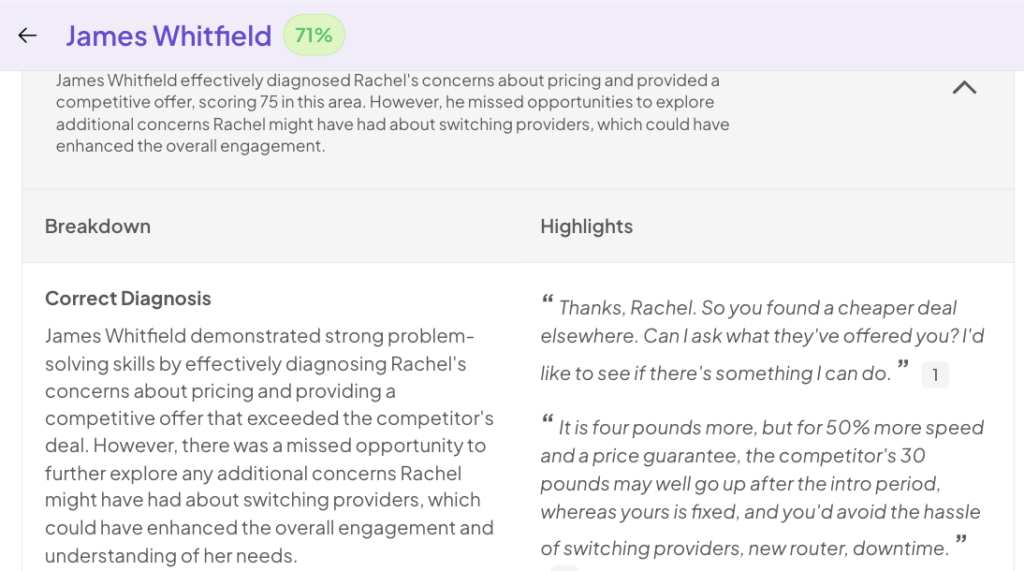
- Link every score to the transcript moment behind it, so an agent can dispute a finding using the same evidence you used to make it. In Insight7, clicking any criterion opens the exact passage behind it, so a disputed score gets settled by listening rather than by rank.
- Fix the workload driver you find. An agent avoiding calls at 92% utilization needs schedule relief before they need a performance conversation.
Detect Call Avoidance Patterns Across Every Call With Insight7
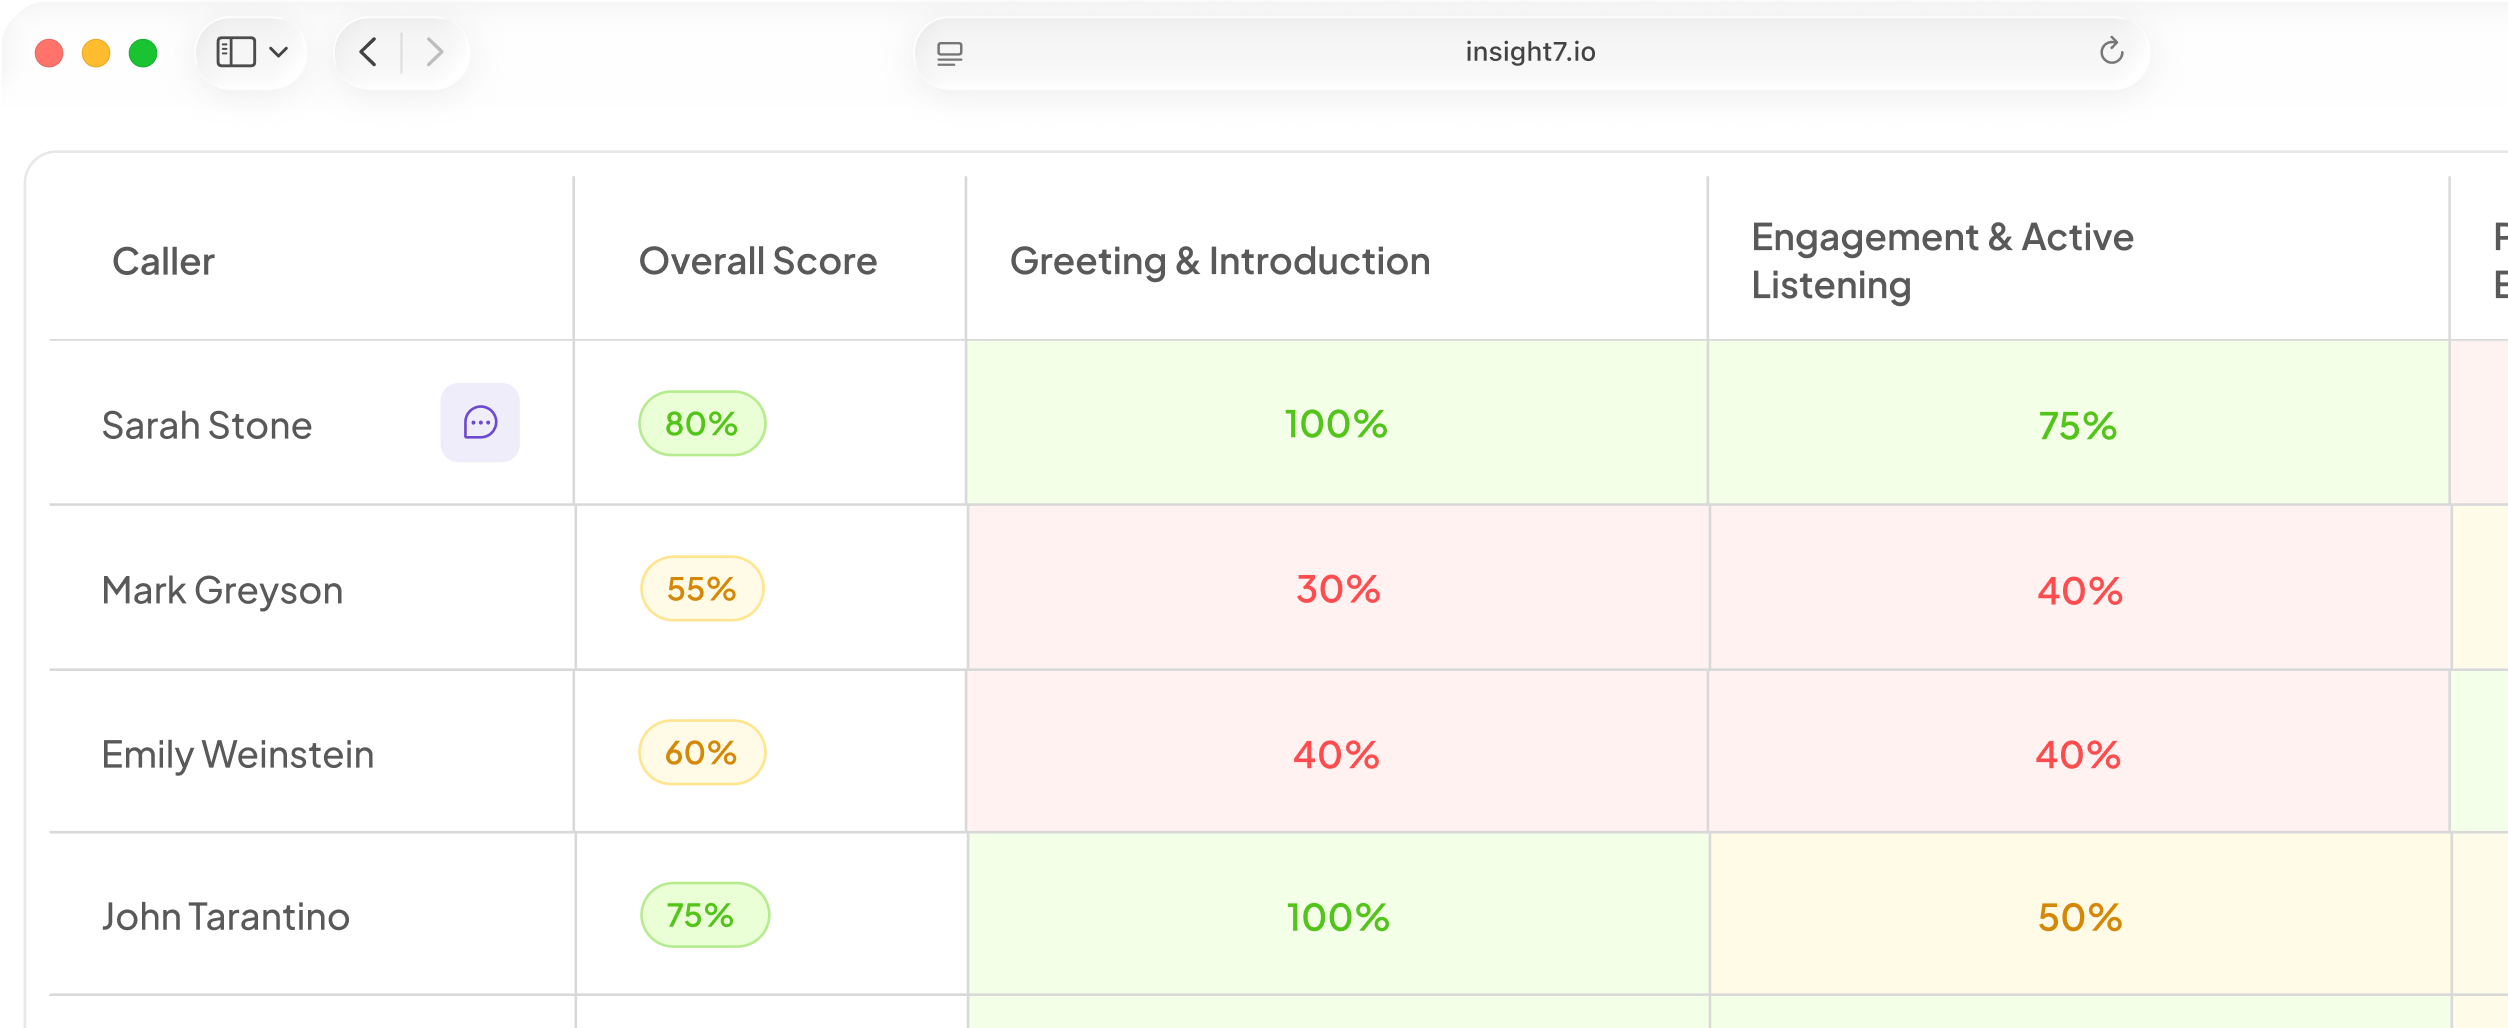
Insight7 scores 100% of your calls against criteria you define, which is what makes pattern-level detection possible. Abrupt disconnects, talk ratio collapse, extended silences, and transfer decisions become scored signals rather than things a supervisor happens to catch.
Every score points directly to the supporting transcript snippet, so feedback sessions always start with clear evidence. If a pattern reveals a clear skill deficit, those findings immediately feed into targeted AI coaching and practice modules to help reps close the gap before their next live call.
Test it for free by running a few calls from two agents and comparing the performance metrics.
FAQs About Call Avoidance in Contact Centers
What is call avoidance in a call center?
Deliberate agent behavior that reduces or shortens customer interactions without resolving the issue, including early hang-ups, unnecessary transfers, extended holds, and aux code misuse.
How do you detect call avoidance?
Look for recurring patterns rather than single incidents. Track short-call rates, agent-side disconnects, hold duration before abandonment, transfer rates on resolvable calls, talk ratio, and wrap-up time, then filter each by queue depth and time of shift.
Can AI detect when an agent hangs up on a customer?
Yes. Speaker diarization identifies which side ended the call and whether the customer was still speaking. Pairing that with repeat contacts from the same number within 24 hours confirms the pattern.