

Usability Journey Visualization offers valuable insights into how users interact with products. It captures the entirety of the user experience, unveiling key moments when users face challenges or find value. By visualizing these journeys, we can pinpoint areas for improvement, making user feedback more actionable.
In usability testing interviews, translating user sentiments and behaviors into visual maps is vital. This process not only enhances understanding but also communicates findings effectively across teams. Through a well-crafted visualization, stakeholders can quickly grasp the user experience, leading to informed decisions and optimized design strategies.
Understanding Usability Journey Visualization in Interviews
Usability Journey Visualization is a critical aspect of understanding user interactions during interviews. By delving into participants' experiences, we can identify crucial friction points across their journey. These visual representations not only highlight user challenges but also reveal opportunities for enhancing their overall experience. Crafting a journey map based on interview feedback serves as a powerful tool in translating qualitative insights into a structured format.
To effectively visualize usability journeys, consider these essential elements:
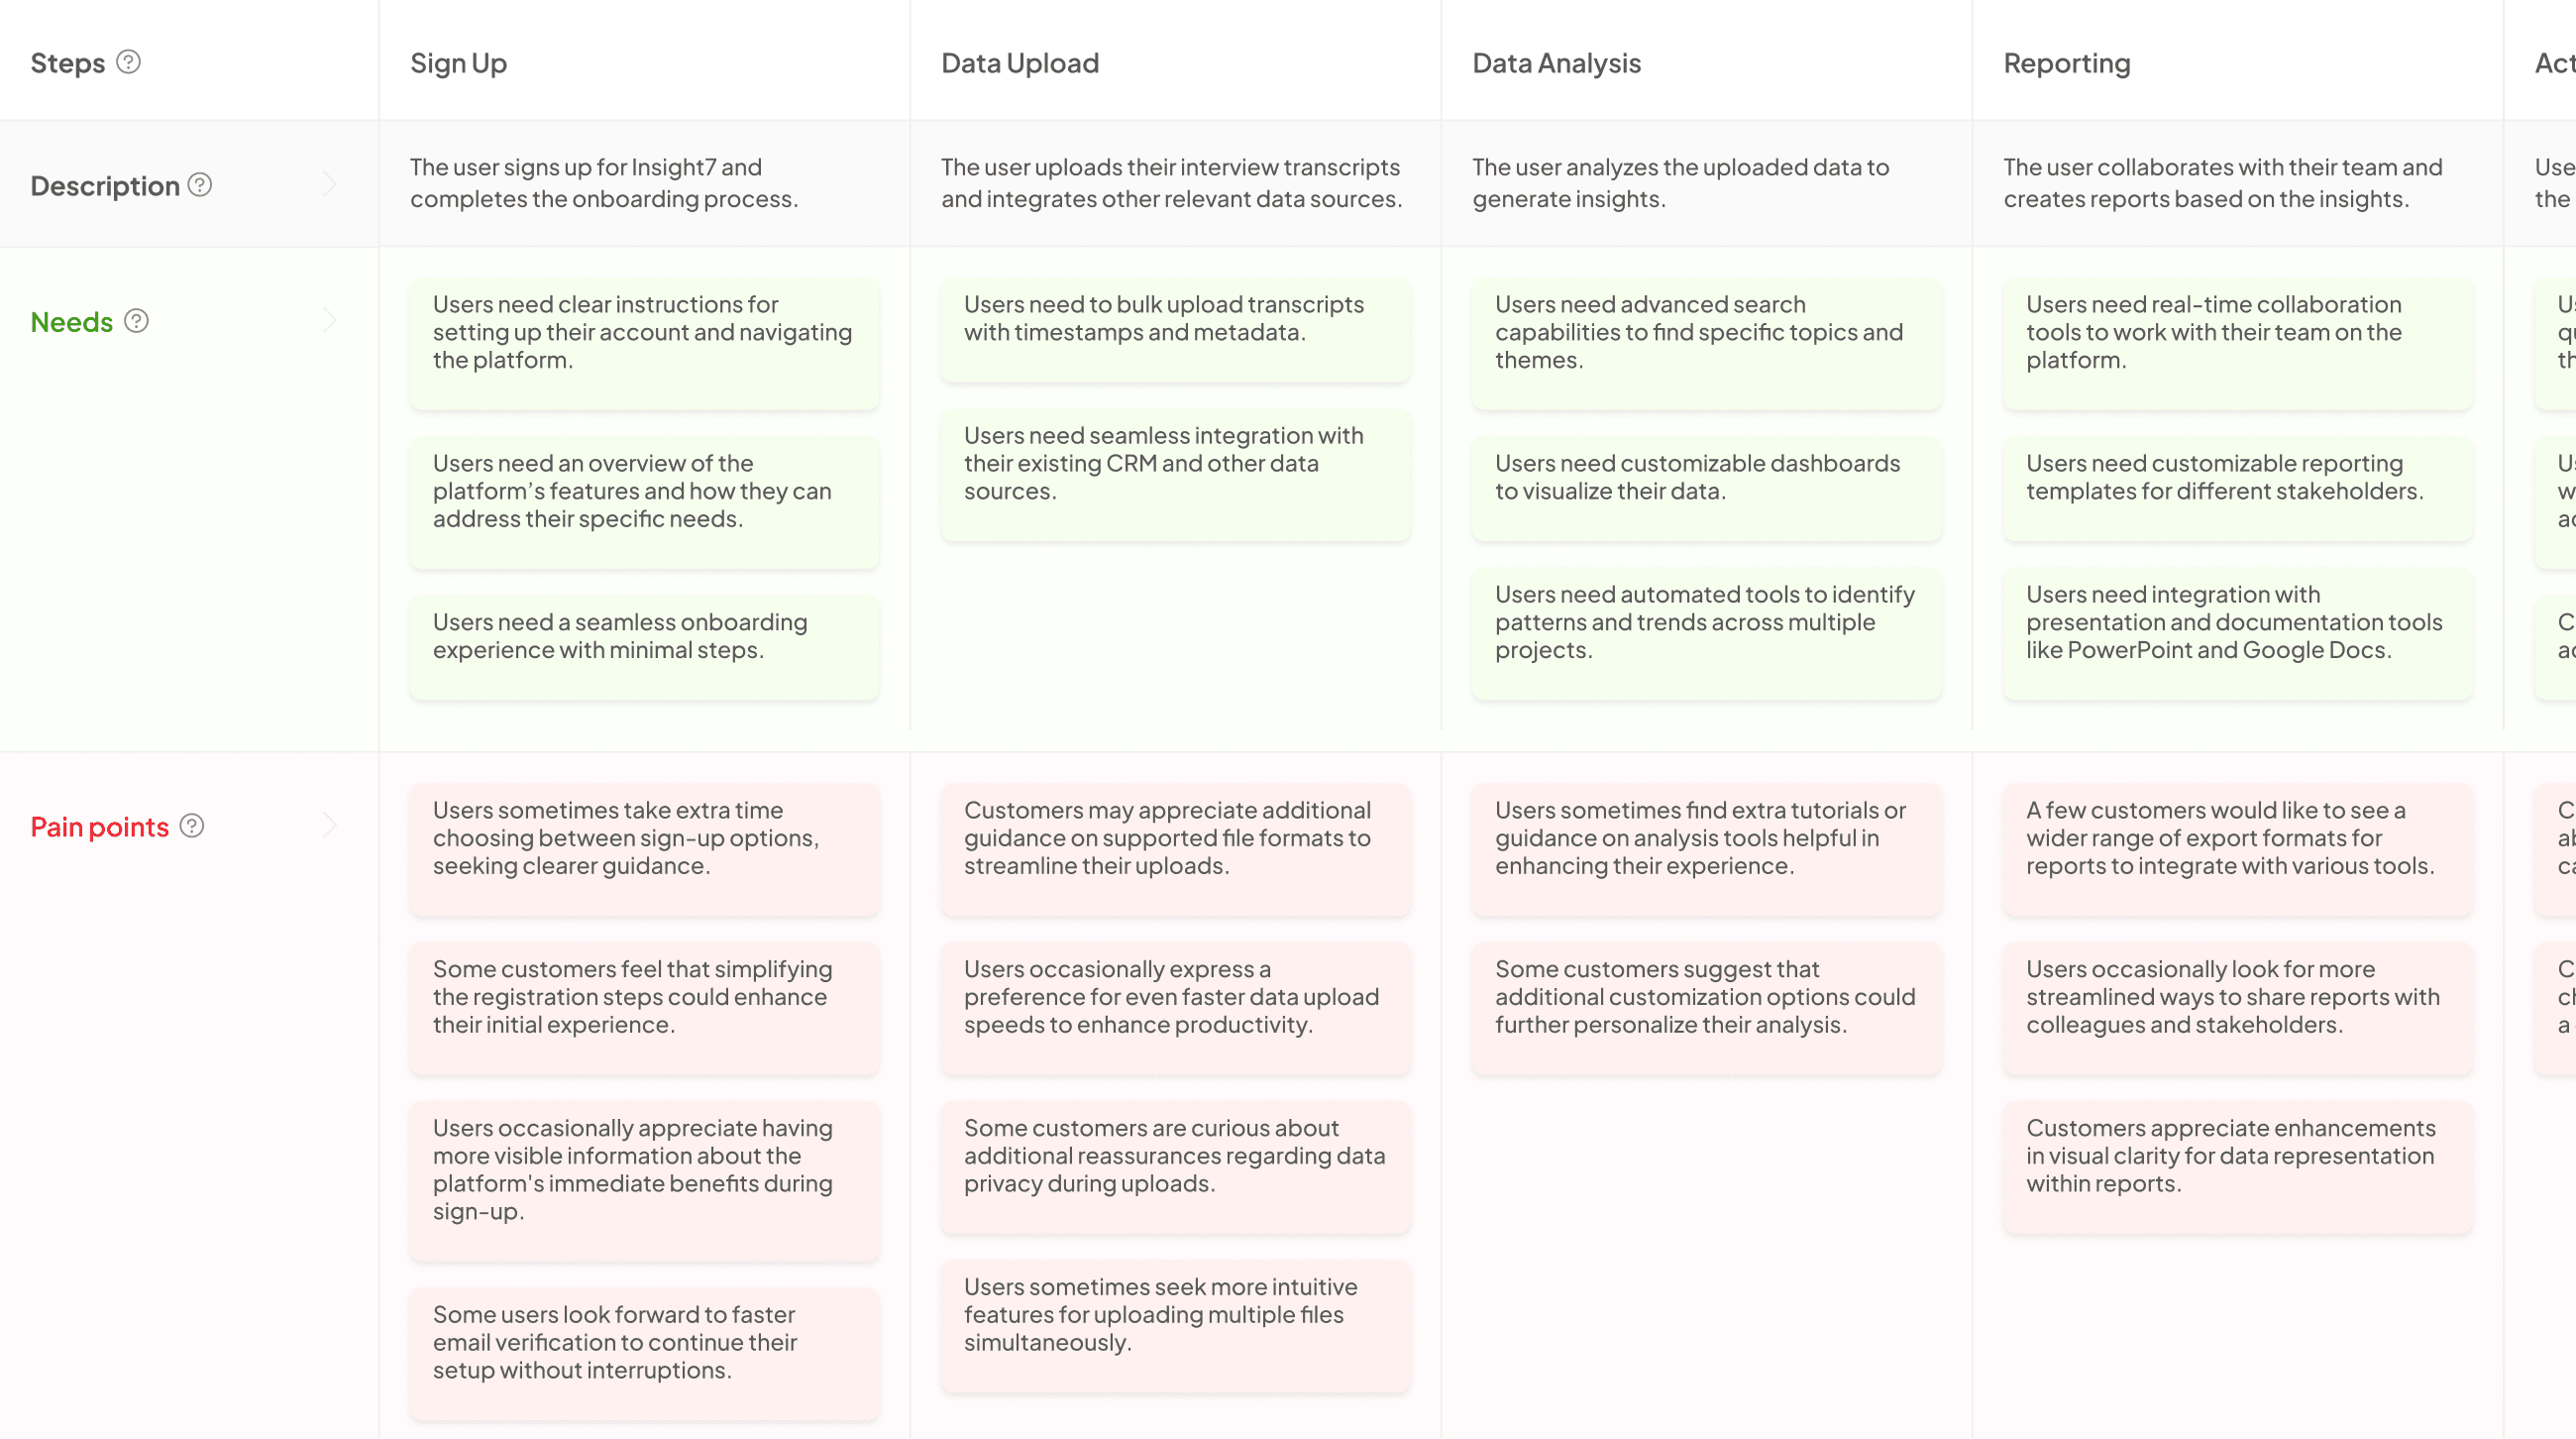
- User Actions: Identify the specific actions taken by users during their interaction phases. This helps pinpoint where they may encounter difficulties.
- Emotional Responses: Document users' emotions at each stage of their journey. Recognizing feelings such as frustration or satisfaction can guide improvements.
- Contextual Factors: Include the context in which users make decisions. This understanding provides deeper insights into their behaviors.
- Recommendations: Based on findings, make actionable suggestions that can enhance user experience.
By integrating these components, usability journey visualizations become instrumental in creating more user-centric solutions.
The Importance of Journey Maps
Journey maps serve as invaluable tools for enhancing user experience by providing clear visual representations of customer interactions. They illustrate each step of a user's journey, highlighting pain points, emotions, and needs throughout the process. By creating these maps, teams can gain critical insights into user behavior, helping to identify areas for improvement or innovation. This Usability Journey Visualization not only enhances understanding but also fosters empathy for the users, ensuring their experiences are prioritized in product development.
In the context of usability testing interviews, journey maps play a crucial role in transforming qualitative data into actionable insights. By synthesizing feedback gathered from interviews, teams can create vivid representations of the user journey, pinpointing specific challenges users face. This enables stakeholders to align their strategies more effectively, ensuring solutions address real user issues. Ultimately, the importance of journey maps lies in their ability to drive informed decision-making and design improvements that resonate with users' needs and expectations.
Translating Interview Data into Visual Maps
Translating interview data into visual maps is crucial for effectively communicating user experiences gleaned from usability testing interviews. This process involves shifting qualitative insights into clear, engaging visual representations that highlight user interactions. First, it’s essential to collect and categorize the raw data from interviews, identifying common themes and pain points. This groundwork lays the foundation for a usable journey map that captures user emotions, motivations, and actions.
Next, using visualization tools, these insights can be transformed into diagrams that show the user journey clearly. Each touchpoint should illustrate critical user interactions and feelings at various stages, making it easier for stakeholders to understand essential issues and opportunities for improvement. By translating interview data into visual maps, teams can foster a shared understanding and guide strategic decisions, ultimately enhancing the overall user experience.
Steps to Creating Effective Usability Journey Visualizations
Creating effective usability journey visualizations involves understanding user experiences from start to finish. The first step is collecting and analyzing data. Gather insights from usability testing interviews, focusing on user actions and responses. This data forms the foundation of your visualization, revealing critical pain points and friction experienced during the user journey.
Next, map user emotions and behaviors. Visualize how users feel at different touchpoints in their journey. By representing these emotions graphically, you can highlight areas for improvement and facilitate a deeper understanding of the user's perspective. Usability journey visualization not only reflects user interactions but also conveys valuable insights that can drive design decisions and enhance overall user experience. Engage in this structured approach to transform raw data into compelling visual stories that resonate with stakeholders and drive actionable change.
Step 1: Collecting and Analyzing Data
Collecting and analyzing data is the cornerstone of effective Usability Journey Visualization. Begin by gathering all relevant insights from usability testing interviews. Analyze this data thoroughly to identify patterns and key themes that emerge from user experiences. Look for recurring feedback and sentiments that highlight both positive and negative aspects of the user journey. This process will provide a solid foundation for your visualization efforts and clarification on user pain points and triumphs.
Next, categorize the analyzed data into manageable sections. This can involve creating distinct segments for user emotions, actions, and thoughts throughout their journey. Use visual tools to represent this data, making it accessible and understandable. The insights derived from rigorous data collection and analysis will shape how you present the User Journey Map, ensuring it resonates and effectively communicates user experiences.
Step 2: Mapping User Emotions and Behaviors
Mapping user emotions and behaviors is a critical step in the usability journey visualization process. By understanding the emotions users experience at various touchpoints during their interaction, you can create more empathetic designs. Start by carefully analyzing the insights from usability testing interviews to capture user sentiments such as frustration, joy, or confusion. These emotions can indicate where users might struggle or succeed in their journey.
Next, visualize the data to identify patterns in user behavior associated with these emotions. Use tools like charts or empathy maps to represent these findings visually. This approach helps stakeholders comprehend user experiences and fosters a collaborative environment for discussing solutions. Ultimately, this mapping process bridges the gap between user feedback and actionable design changes, increasing the overall effectiveness of your products. Understanding users on a deeper level allows for improved usability and satisfaction, paving the way for enhanced user experiences.
Essential Tools for Usability Journey Visualization
When embarking on the usability journey visualization, selecting the right tools can significantly impact your results. Effective usability journey visualization tools help transform complex data from interviews into clear and actionable graphics. Utilizing applications like Miro or Lucidchart enables teams to collaborate in real time, fostering a shared understanding of user experiences and pain points.
To achieve comprehensive visualization, consider tools that allow integration of different data types, such as video or transcripts. Insight7, for instance, integrates interview data with visual mapping, allowing you to see patterns and trends more effectively. Additionally, platforms like Optimal Workshop and UXPressia offer specialized features designed specifically for usability journey mapping, equipping you with essential capabilities to visualize user experiences efficiently. With these tools, the visualization process becomes accessible, enabling deeper insights that drive user-centered design improvements.
insight7
Creating usable journey maps from usability testing interviews involves a structured approach. Insight7 plays a crucial role in facilitating this process. Users must first collect and analyze data from their interviews, focusing on the core issues highlighted by participants. Engaging with these insights allows for a better understanding of customer needs, which informs the subsequent mapping process.
Next, mapping user emotions and behaviors is essential. This step ensures that the visual representation reflects not just actions, but the feelings associated with those actions. Utilizing effective tools, such as Optimal Workshop and Miro, can help create engaging visuals that clearly depict the customer’s journey. By transforming raw interview data into compelling visuals, teams can foster collaborative discussions and drive improvements in their overall user experience strategy.
Optimal Workshop
The Optimal Workshop tool is highly beneficial for visualizing usability journeys derived from interviews. It provides a straightforward interface that even those without technical expertise can navigate. By offering an accessible platform, users can easily transform qualitative insights into visual representations, making complexities simple to understand. This is particularly useful when identifying pain points and user behaviors, allowing teams to address issues more effectively.
With Optimal Workshop, users can seamlessly compile data from multiple sources and create journey maps. This process allows for a clearer understanding of customer experiences and expectations. By visualizing these journeys, businesses can pinpoint friction areas and enhance their overall user experience. Thus, Optimal Workshop plays a critical role in usability journey visualization, fostering informed decision-making and strategic planning in product development.
Miro
Miro serves as an essential tool in the realm of Usability Journey Visualization. By offering a flexible and collaborative workspace, Miro enables teams to transform raw data from usability testing interviews into meaningful journey maps. This platform allows for easy integration of diverse elements, such as user personas and experience timelines, which fosters a comprehensive understanding of user journeys and emotions.
Utilizing Miro for visualization involves several key steps. First, gather insights from usability tests, focusing on user feedback and behavior patterns. Next, create a visual map that illustrates these findings, highlighting crucial touchpoints and emotional shifts. Miro’s intuitive interface streamlines the process, promoting collaboration among team members. You can enrich the journey maps with color codes and graphics, ultimately enhancing clarity and engagement. By employing Miro, teams can effectively visualize user journeys, paving the way for informed design decisions and enhancements.
Lucidchart
Lucidchart serves as a powerful tool for Usability Journey Visualization, allowing teams to collaboratively create detailed and engaging journey maps. This platform simplifies the visualization process by providing an intuitive interface that enables users to easily transform complex data into clear visuals. Whether you are mapping user emotions or tracking their journey through various touchpoints, Lucidchart helps in presenting information both attractively and accessibly.
To effectively utilize Lucidchart, consider these key features:
- Collaboration Options: Teams can work together in real time, leading to more comprehensive insights and shared understanding.
- Templates and Examples: Lucidchart offers a variety of templates that can help jumpstart the mapping process and ensure essential elements are included.
- Integration with Other Tools: The platform seamlessly integrates with other applications, simplifying the importation of data sources for more thorough analysis.
By leveraging the capabilities of Lucidchart, you can enrich your Usability Journey Visualization and create impactful journey maps that communicate user experiences effectively. Such visualizations promote understanding among stakeholders, driving informed decision-making within the organization.
UXPressia
UXPressia is a powerful tool designed to enhance the visualization of usability journey maps derived from usability testing interviews. By facilitating a user-friendly interface, it allows teams to seamlessly compile, analyze, and display valuable insights from customer interactions. The platform democratizes the data, enabling anyone within your organization to contribute to the journey mapping process without requiring extensive training or technical expertise.
With UXPressia, you can effortlessly convert raw interview insights into coherent visual representations. This is achieved through features that highlight user emotions, expectations, and pain points across the customer journey. As a result, stakeholders gain a clearer understanding of user interactions, making it easier to pinpoint areas demanding attention and improvement. By utilizing UXPressia, organizations can elevate their usability journey visualization efforts and better align their products with user needs.
Conclusion: Mastering Usability Journey Visualization
Mastering Usability Journey Visualization is about transforming complicated user experiences into clear, actionable maps. These maps reveal users' pain points and highlight their needs as they navigate a product or service, enabling teams to empathize and innovate effectively. By visualizing journey maps, insights gathered from usability testing interviews become powerful tools, guiding design improvements and strategic decisions.
With a well-crafted journey map, organizations can uncover critical moments that shape user satisfaction. The goal is to create visuals that not only inform but also inspire change, driving an enhanced user experience. This process ultimately leads to better products and services, promoting a deeper understanding of customer behavior and expectations.


