
Your logs say every call connected and finished, yet callers hang up on long pauses, talk over the bot, or sit in silence. Total call time hides all of it. To monitor AI voice agent latency, build three things: instrument, alert, dashboard.
Timestamp every turn, not just the call
Log one timestamp per event in every turn, then compute your metrics from those events. Capture these fields:
- Caller speech start and end, from voice activity detection (VAD)
- ASR final transcript time
- LLM first token
- TTS first audio byte
- Audio playout start at the telephony edge
- Barge-in events
- Start and end of each tool call
- Carrier ID and call ID
Measure at the audio edge, where the carrier plays audio to the caller. Your server clock stops when it sends the first TTS bytes, so it misses the network and carrier delay.
Define three metrics before you chart anything:
- Response latency: caller end-of-speech to first agent audio.
- Dead air: silence longer than a set length while the agent owes a turn. Tag it agent-caused or caller-caused.
- Interruption: caller speech overlapping agent audio. Tag each as a barge-in handled well, the agent talking over the caller, or a false barge-in from noise or echo.
Give each call one trace ID and each turn a span. In OpenTelemetry, a trace is a set of spans that share a trace ID, and each span can carry timestamped events. Store the same ID on the recording and the transcript, so a slow span takes you straight to the audio.
You also need a yardstick for "natural." Across 10 languages, responses to a question land within about 200 ms of its end. Your agent will run slower, and callers hear every extra half second.
Insight7's campaign dashboard, in beta, shows calls in progress and lets a reviewer read each transcript when the call ends. It counts a call as reached only when the customer spoke, so AI-only calls do not inflate your reach rate. A carrier's temporary refusal does not use up one of the contact's retries. You can also test a campaign's agent in the browser, with no phone number. Browser tests skip the carrier leg, so use them to check that your timestamps fire, not to set baselines.
Track percentiles per stage, split by call type
Report p50, p95 and p99 for every latency metric, and drop the average. A mean of 1.1 seconds can hide a tail where one turn in twenty takes four seconds, and callers remember that turn.
Give each stage its own budget and chart it separately:
- ASR endpointing (how long the system waits to decide the caller is done)
- LLM time to first token
- TTS time to first byte
- Telephony and network, from your server's first byte to playout at the edge
When p95 climbs, the stage that grew is your first suspect.
Then split every chart by carrier, region, language, campaign type, time of day and model version. Add one more split: turns with a tool call and turns without. A CRM lookup mid-turn is the usual cause of a long pause, and a blended number buries it.
Use histograms, not pre-computed percentiles. Prometheus documents that histograms aggregate by summing their buckets. That lets you combine servers or carriers and still get a valid p95. Place bucket edges around your alert thresholds.
Also track silence events per 100 calls. A rate stays comparable when volume changes.
Finally, add one outcome metric: the share of answered calls where the customer spoke, plus hang-ups within a few seconds after a long pause. If latency improves but speech-reached does not, you are fixing the wrong thing.
Set alert thresholds from your own baseline
Run one to two weeks of baseline, then set a warn level and a page level for each metric. Alert on a rate or percentile over a rolling window, never on a single call. One slow call is noise. Twenty minutes of slow p95 is an incident.
The network leg has hard limits. ITU-T G.114 says one-way delay should stay under 400 ms for general planning. It also warns that highly interactive voice calls can suffer at much lower delays. Your ASR, LLM and tool time stack on top.
These multipliers are our own illustrative defaults, not industry standards. Tune them to your baseline.
| Metric | Warn | Page | First thing to check |
|---|---|---|---|
| p95 response latency | 1.25x baseline | 1.5x baseline | The stage that grew |
| p99 latency | 1.5x baseline | 2x baseline | Tool-call turns |
| Dead air per 100 calls | 2x baseline | 4x baseline | Agent-caused or caller-caused tag |
| Agent talks over caller | 2x baseline | 3x baseline | Endpointing settings |
| False barge-in rate | 2x baseline | 3x baseline | Echo, noise, VAD threshold |
| Silent answered calls | 2x baseline | 4x baseline | Carrier route |
| Per-carrier error rate | 2x fleet median | 4x fleet median | Carrier status |
Send each alert to the team that can fix it. Carrier problems go to telephony, slow models or tools to engineering, and bad barge-in to the conversation designer.
Add a kill switch for silent answered calls. Insight7 is building a campaign pause for this case.
Keep alerts quiet enough to trust:
- Set a minimum sample size per window.
- Use hysteresis, so an alert clears only after the metric stays healthy.
- Annotate deploys and prompt changes.
Build a dashboard that answers three questions
Design the dashboard around three questions: Is something broken right now? Which stage or segment is it? Which calls do I listen to?
Top row: live health. Show calls in progress, p95 response latency, silent-call rate and a last-hour trend. This row answers the first question in seconds.
Middle: where it hurts. Chart latency by stage as stacked bars, so the stage that grew stands out. Next to it, chart dead air and interruption rates by carrier, language and campaign. This row answers the second question.
Bottom: the worst calls. List them with a link to the audio and transcript at the exact timestamp of the bad turn. This answers the third question, so nobody scrubs through a 6-minute recording.
Overlay deploys, prompt changes and model switches on every chart. A step in p95 that lines up with a release is usually your cause.
Then link metric to outcome. Plot response latency against hang-up rate and speech-reached rate. If a slow bucket shows no extra hang-ups, do not spend your sprint there.
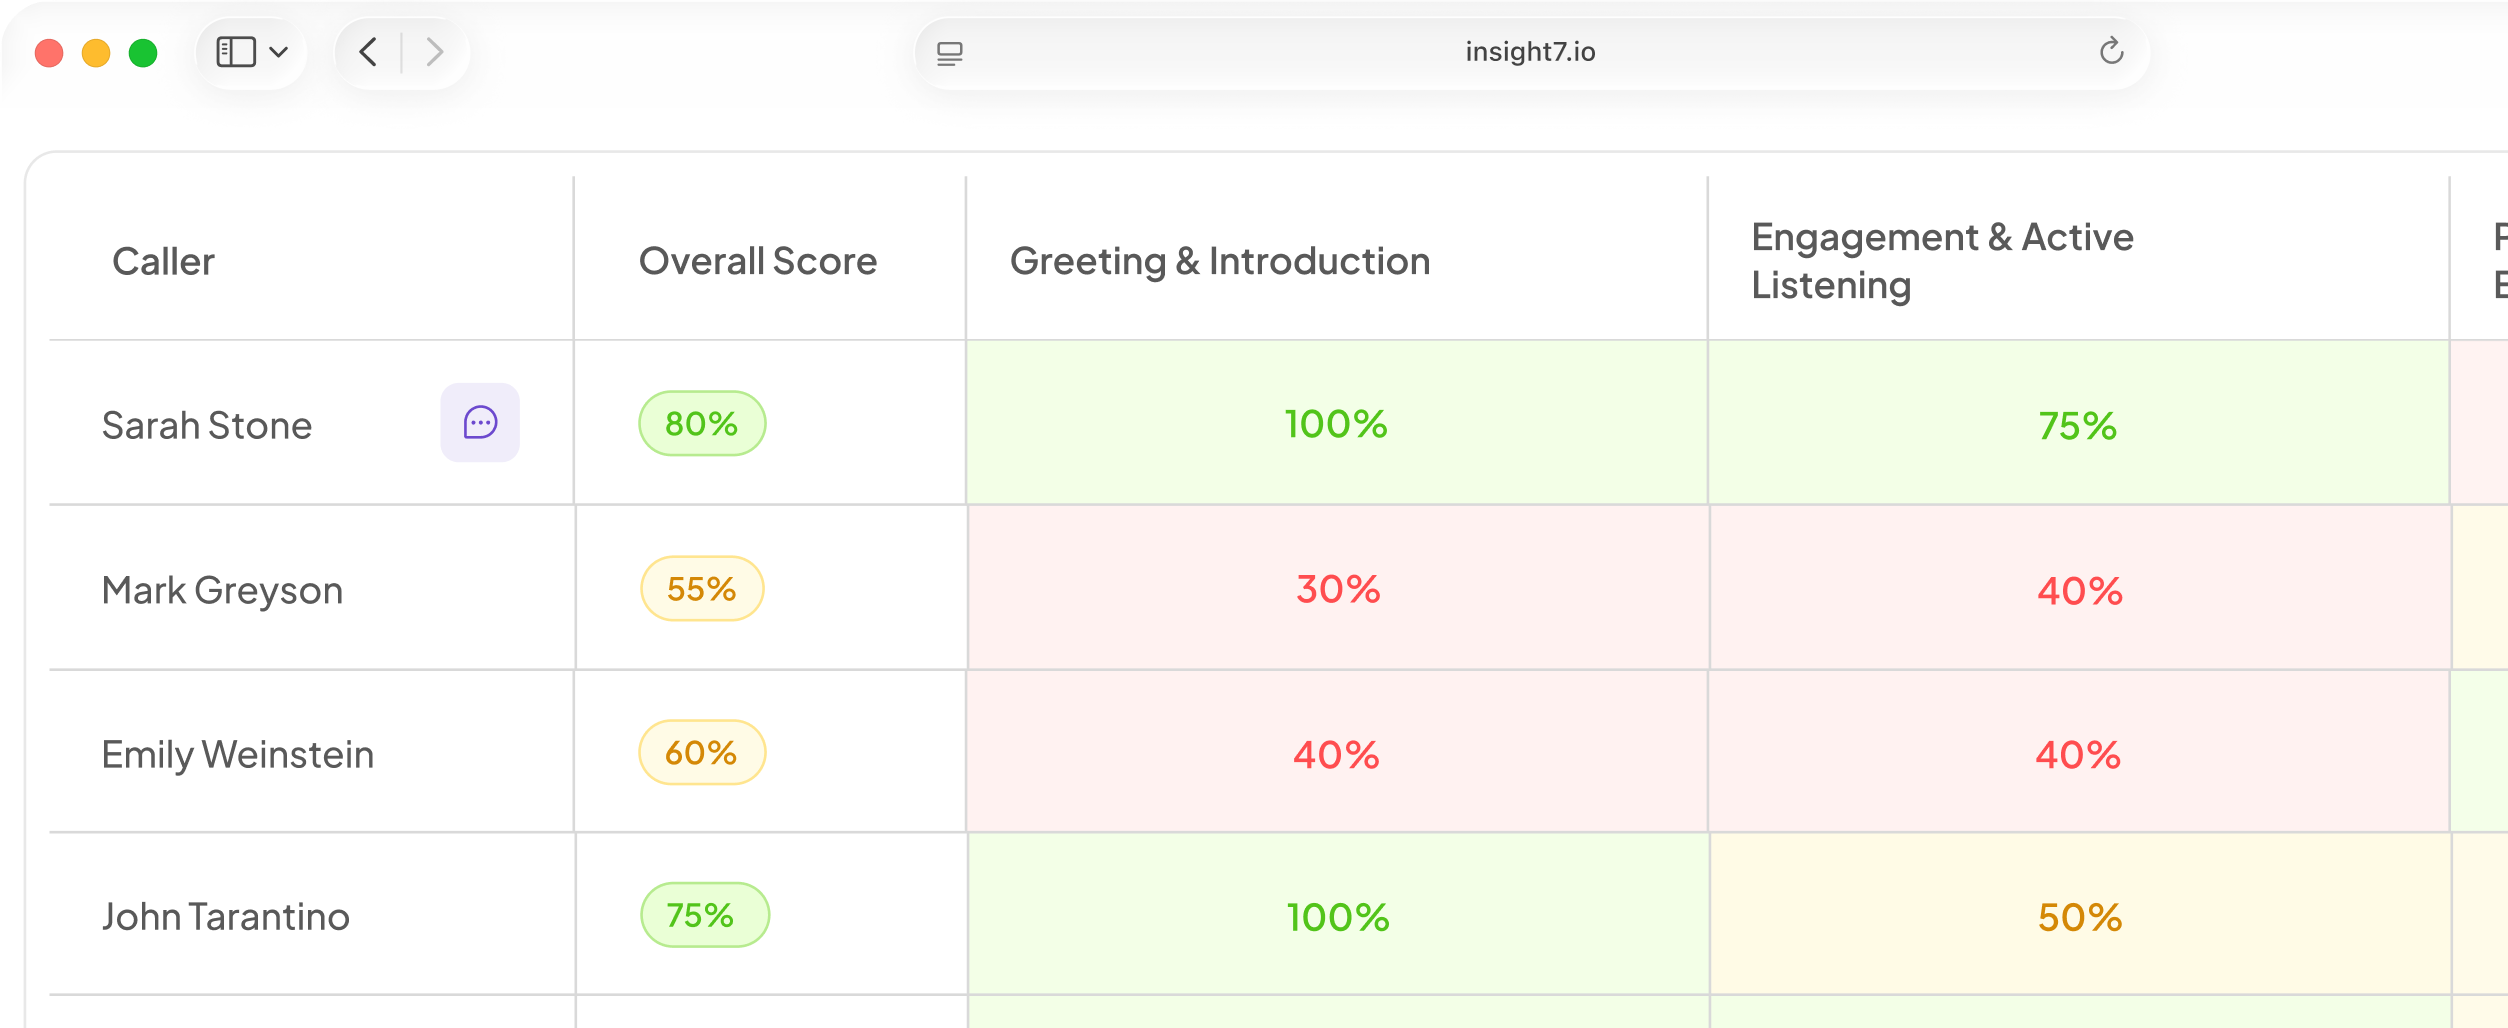
Latency numbers do not show whether the call went well. Insight7 can score every call against a weighted scorecard your team owns, not a sample. Add a critical-error rule, because a call can pass on procedure and still leave the customer angry.
Alerts can also watch keywords and low scores and notify by email or Slack.
To try scoring on a few recordings first, the free Call Quality Monitor turns uploaded audio or transcripts into scorecards.
Review weekly and feed fixes back
As a starting point, block 30 minutes every week to listen to the 10 worst calls by latency, interruptions and silence. Scale this to your call volume. Tag each one with a root cause: ASR endpointing, slow tool, TTS, carrier or a prompt that is too long. After a few weeks, the tags show which lever to pull first.
Match the fix to the tag:
- Tune endpointing and VAD thresholds.
- Stream TTS instead of waiting for the full reply.
- Cache or pre-fetch tool lookups.
- Play a filler phrase while a slow lookup runs.
- Lower barge-in sensitivity if noise keeps cutting the agent off.
- Switch the carrier route.
Re-baseline your thresholds each month, and after any model or voice change.
Watch handover too. Gartner's 2026 survey of 3,566 customers found 87% say a way to reach a human is essential when a company uses GenAI. Track how often callers ask for a person, and how long the transfer takes. A rising ask rate often follows a latency spike.
Related reading: 8 Best AI Agent Monitoring and QA Tools for Contact Centers, How to Measure Whether AI Agent Changes Improved Results Using Holdout Groups and 10 Inbound AI Agent Metrics Including Containment Rate, Handoff Reasons and Dead Air.
Questions people also ask
What is a good latency for an AI voice agent?
Humans answer within about 200 ms, so every agent is slower. Set your target from your own baseline and hang-up data. The right limit is the response time beyond which callers hang up.
How do you measure latency in a voice AI agent?
Subtract adjacent event timestamps to get each stage's time, then sum the stages. Sync clocks across services, or the subtraction gives false numbers. Keep the playout timestamp from the telephony edge.
What causes dead air in AI voice calls?
Common causes are slow tool calls such as CRM lookups, late ASR endpointing, and slow TTS start. Carriers that connect the call but deliver silence also cause it. Tag each event as agent-caused or caller-caused.
How do you stop an AI voice agent from interrupting callers?
Lengthen the endpointing wait so the agent does not mistake a pause for the end of a turn. Then tune VAD sensitivity. Review calls tagged "agent talked over caller" weekly.
What metrics should you track for voice AI agents in production?
Track response latency, dead air per 100 calls, interruption types, silent answered calls and per-carrier error rate. Add an outcome metric, such as the share of answered calls where the customer spoke. Insight7 counts a call as reached only when the customer spoke.
How do you test a voice AI agent before going live?
Talk to the agent in the browser to check timestamps and flow. Then place a test call to your own phone to hear the carrier leg. Use the phone call for real latency numbers.
How many calls should you review to monitor voice agent quality?
Metrics and scoring can cover every call. Humans should review the worst calls per failure type each week, plus a few random calls to check that automated scores match human judgement.
Make every call easy to replay
Monitoring pays off when every call is timestamped, scored and replayable. Insight7 scores every call against a team-owned scorecard. This week, log four timestamps per turn on one live campaign and replay its 10 slowest calls.