
Freshdesk Alternative for Banks in Nigeria: 5 Options Compared
Key Takeaways The CBN fined 21 Nigerian financial institutions ₦430 million in 2025 for one reason: failing to resolve customer complaints on time. Not for the complaints themselves. For losing track of them. That is the risk hiding inside a ticketing tool that cannot hold a team accountable once a complaint passes through their queue. Freshdesk tracks whether a ticket is open or closed. It was never built to prove what actually happened on the call behind it, which is exactly what a regulator asks for. This guide compares the best Freshdesk alternative options for banks in Nigeria, so the next complaint does not become the next fine. Best Freshdesk Alternatives for Banks in Nigeria: Quick Look Tool Best For Standout Feature Starting Price Insight7 QA coverage, coaching, and compliance in one platform Scores 100% of calls, not a manual sample Free trial, $99/month Zendesk Large banks needing deep channel coverage 10+ native channels, largest app marketplace $25/agent/month Zoho Desk Smaller branch networks on a budget Lowest entry price with real ticketing features ₦6,930/agent/month BoldDesk Banks where social media drives most volume Native WhatsApp, Instagram, and Facebook support $124 / month HubSpot Service Hub Banks already using HubSpot for sales or marketing One shared record between sales, marketing, and support $10/seat/month See what 100% call coverage looks like for your team. Try Insight7 free, no card required. Insight7: Best for QA, Coaching, and Compliance in One Platform Insight7 is a call intelligence and AI coaching platform built for teams that need to see what happened on a call, not just track whether a ticket got closed. For a bank, that difference matters more than almost anywhere else in the business. Say a compliance officer is trying to prove that every agent read the required disclosure on 20,000 calls last month. A ticketing tool can tell you the ticket was marked resolved. It cannot tell you whether the disclosure was said. Insight7 can, because it listens to the call itself. Key Features Three features separate Insight7 from a ticketing tool that was never built for banking compliance and coaching. Insight7’s AI Call Scoring evaluates every call, not a sample of it. Most contact centres manually review under 10% of interactions, usually scored through something like a Microsoft Forms survey feeding a Power BI dashboard. That works fine for a small team. It breaks down fast once volume climbs, because a human reviewer can only listen to so many calls in a day. Insight7 scores every recorded call against your own rubric and shows exactly which moment triggered each score, so a QA lead can see the evidence instead of taking a rating on faith. Once a call is scored, AI Coaching turns that specific gap into a practice scenario. This replaces the “listen to this call, what did you do wrong” model most banks still run, where coaching depends entirely on a manager’s calendar and memory. A rep who struggled with an angry customer over a failed transaction gets a roleplay built around that exact scenario, not a generic training module. Compliance-Ready Data Handling Banks carry a heavier compliance load than most industries. A Nigerian bank has to satisfy CBN liaison requirements and enforce data-masking rules, showing only the first six and last four digits of a card number, on every transcript. Insight7’s PII/PHI redaction handles this automatically at the platform level, rather than depending on an agent to remember to redact manually every time. Pricing Plan Price Best For Pro $99/month ($990/year billed annually) 1 user, 50 call analyses/month Business $299/month ($2,990/year billed annually) 3 users, 200 call analyses/month, PII/PHI redaction, AI roleplays included Plus $1,499/month ($14,990/year billed annually) 20 users, 2,500 call analyses/month, full AI coaching feedback Enterprise Custom Unlimited users and analyses, API access, dynamic evaluation criteria Where Insight7 Shines Where Insight7 Falls Short Customer Reviews “Before Insight7, we manually analysed user feedback. It was time-consuming and limited product iteration. With Insight7, that time has been cut in half. We seamlessly extract product insights and generate reports efficiently.” — Toye Fatolu, Product Designer, Terragon Group” “I was able to analyze customer calls I had using Insight7 and I did find it valuable! I loved how it showed the sentiment behind each comment that the client made.” — Tobi Oluwole, Co-founder, 3skillz Who Insight7 Is Best For See what 100% coverage looks like on your own calls? Try a free Insight7 Plan here. Zendesk: Best for Large Banks Needing Deep Channel Coverage Zendesk is the tool most enterprise support teams land on once they outgrow Freshdesk’s simpler ticketing model. It supports over 10 channels natively, including email, chat, voice, WhatsApp, and Instagram, which matters if your bank’s support volume is genuinely spread across that many entry points. Key Features Pricing Plan Price Support Team $25/agent/month Suite Team $69/agent/month Suite Growth $149/agent/month Where Zendesk Shines Where Zendesk Falls Short Customer Reviews G2 reviewers consistently praise Zendesk’s intuitive interface and ease of ticket management. A recurring complaint across reviews is that advanced features and deeper automation stay locked behind higher-tier plans, which pushes total cost up faster than the headline price suggests. Who Zendesk Is Best For Zoho Desk: Best for Smaller Branch Networks on a Budget Zoho Desk is usually the first name that comes up when a support team is price-sensitive. It undercuts Freshdesk’s entry pricing at every comparable tier while still offering automation and SLA tracking. Key Features Pricing Plan Price Free 3 agents, basic ticketing Express ₦6,930/agent/month Standard ₦15,400/agent/month Professional $₦26,950/agent/month Enterprise $₦38,500/agent/month Where Zoho Desk Shines Where Zoho Desk Falls Short Customer Reviews Capterra reviewers highlight Zoho Desk’s customizable dashboard and real-time SLA tracking across multiple brands as standout strengths. A recurring theme in reviews is that the value proposition depends heavily on how deep a team goes into the wider Zoho ecosystem, since standalone Zoho Desk feels less complete than the bundled version. Who Zoho Desk Is Best For BoldDesk: Best for Banks Where Social Media Drives Most Volume BoldDesk is built with finance
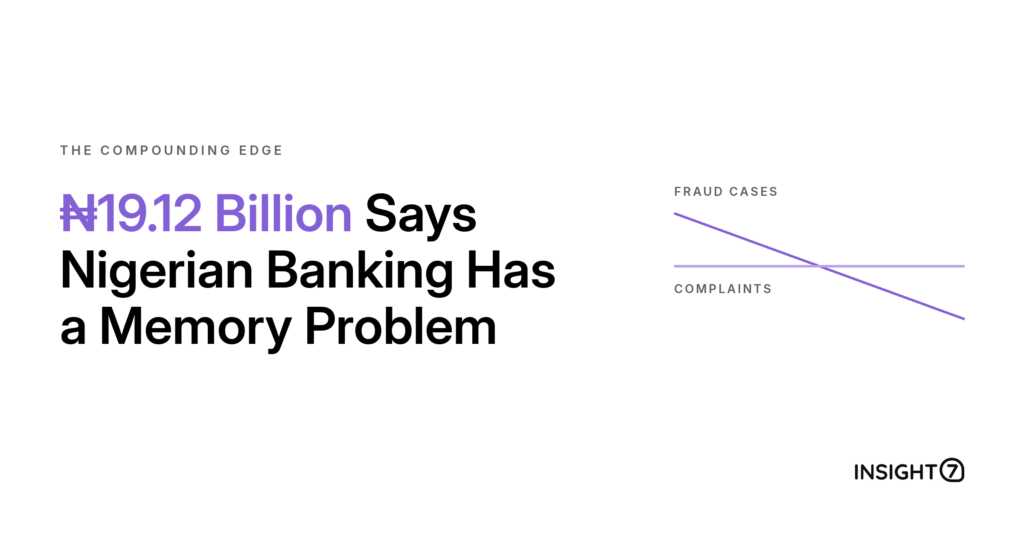
₦19.12 Billion Says Nigerian Banking Has a Memory Problem
Sit with a Nigerian contact centre team for a week and you will hear the same four or five problems circulating. Failed transfers, unauthorised debits, disputes over charges. Your agents resolve them properly and the tickets close cleanly. Then the identical issue arrives the following month and lands on somebody solving it for the first time, because nothing in your operation retained how it was fixed before. That gap has a price, and last year, the Central Bank put a number on it. Nigerian banks refunded ₦19.12 billion to customers. When your support system lacks knowledge retention, simple service glitches cascade into severe compliance penalties and mandatory payouts. So, how do you prevent these multi-million-Naira mistakes month after month? Why Nigerian financial institutions refunded ₦19.12 billion to customers in 2025 The Central Bank of Nigeria resolved 18,824 consumer complaints last year, and institutions refunded ₦19.12 billion alongside $329.3 million as a result. Several also paid penalties for taking too long to resolve them. The naira figure nearly doubled from ₦9.66 billion the year before. Claims lodged in local currency climbed to ₦40.61 billion from ₦17.13 billion, which tells you the pool of disputed money is growing faster than the refunds settling it. The CBN reads the rise as evidence that more Nigerians now know they can escalate, and that interpretation is fair. Consumer protection awareness is healthy for the market. But it doesn’t change is the mechanics inside your contact centre, where every one of those complaints arrived without any record of how the last identical one was handled. Why bank customer complaints in Nigeria keep recurring month after month The striking thing about complaint volume across Nigerian financial services is how little the underlying list changes. Failed transfers, unauthorised debits, disputes over charges, airtime that never landed. Whether you run customer operations at a commercial bank, a fintech, a microfinance institution or an insurer, you already know your top five and could probably recite them in order without checking a dashboard. What changes is which agent picks up and that agent is usually meeting the problem for the first time. So the unit cost of resolution never falls. You pay once when the customer calls, then again when the same issue returns wearing a different reference number. That pattern has a name worth borrowing from finance. An operation that copes handles each complaint properly and retains nothing, so the cost of solving it stays flat forever. An operation that COMPOUNDS gets a little cheaper to run every month, because each resolution feeds something that reduces the next one. Odun Odubanjo, Chief Executive Officer at Insight7, sees the gap as a memory problem: “Institutional forgetting costs more than any refund. Nigerian institutions pay twice for the same problem, once at resolution and again when it returns the following month.” None of this stays inside the building. Customers experience it as the same problem coming back, and the industry research has been recording that for years now. KPMG’s West Africa research on customer experience in banking placed Resolution, meaning proactive correction of the customer’s problem, at the bottom of its six experience pillars for Nigerian retail banking across successive editions. Reading that as a scoring quirk would be a mistake. It describes an operating model where each ticket functions as a closed loop with nothing downstream of it, repeated across an industry. The scale of what gets discarded in the process is genuinely striking. Nigeria processed ₦1.07 quadrillion in electronic payments in 2024, across active bank accounts that rose to 311.6 million. Your institution holds the richest behavioural dataset in the Nigerian economy yet most of it evaporates the moment somebody marks a ticket resolved. How Nigeria’s fraud teams built a system that learns from every incident The proof that this can work already exists inside your industry, one department over. Fraud case volumes fell from 123,918 in 2021 to 67,518 in 2025. Loss values dropped 51% in the most recent year, from ₦52.26 billion to ₦25.85 billion, though that particular comparison is flattered by a single ₦31.1 billion incident inflating the 2024 baseline. The case-count trend is the honest evidence, and the mechanism behind it is worth studying. Institutions shared threat signals with each other, tightened controls after every incident, and adapted so that each attempt became harder to execute than the one before it. That is an ecosystem with a memory. Customer complaints arrive in far higher volume than fraud attempts ever have, and nobody has pointed the same engine at them, though a handful of operations elsewhere have tried something close. Three operations that read every conversation before changing anything These attempts below share a sequence: coverage came first, then whatever the reading turned up got spent on making people better. Nobody in these groups bought a tool and waited for it to work. They read the conversations first, then acted on what the reading exposed, which is the part that transfers to a Nigerian operation regardless of budget. Four questions that reveal whether your CX operation is compounding or coping Run these past your leadership team and count the yeses. Four nos describes an operation that is well run and going nowhere. CX expert, Ubong Nkata, points at what usually sits behind those four nos: “Effort is not a service improvement strategy.” Ubong Nkata, Customer Experience Leader His argument is that growth exposes whatever an organisation has been managing informally. Unclear responsibilities turn into missed actions, weak processes turn into delays, and when critical knowledge lives with one capable person, even your most committed employee becomes a bottleneck. Pushing the team to try harder does nothing about any of that, because the constraint has moved from the people to the operating system around them. What one failed USSD transfer should tell five teams inside your bank Say a customer whose USSD transfer failed calls, your agent sorts it out, the ticket closes cleanly. Everybody involved did their job properly. That single interaction carried usable information for
How to Measure Empathy on Customer Calls (2026 Data+Examples)
Key points Your QA scorecard probably measures script adherence, account verification, and handle time. Yet empathy in customer service sits below that, scored out of five by whoever happened to listen, and treated as a trait the agent either has or does not. Well, good news. Empathy in customer service is measurable, and our own data on 6,209 sales calls shows it separating performance tiers more sharply than any other behaviour we track. Here’s what the scored conversations showed and example statements you can start using right away. Can empathy be measured on a sales or customer service call? Yes. Empathy has been scored objectively from conversation data in peer-reviewed research since at least 2014, using two independent methods. Language style synchrony Researchers at the University of Washington and the University of Utah analysed 122 counselling transcripts totalling more than 362,000 words, measuring how closely the two speakers matched each other’s phrasing patterns. Sessions rated high on empathy showed significantly greater language style synchrony across 11 linguistic categories than low-empathy sessions, at p less than .01, with a substantial effect size of d = 0.62. The finding held even after controlling for reflective listening statements, which means synchrony captured something the obvious verbal cues missed. Vocal pitch synchrony A separate study from the same research group extracted vocal arousal measures from 89 sessions and tested whether speaker and listener pitch tracked together. Higher synchrony aligned with higher observer ratings of empathy. Both methods share one useful property for anyone running QA: they score from the recording, with no observer sitting in and no self-report survey afterwards. What our own call data shows We scored 6,209 real sales conversations across 12 dimensions and sorted them into performance tiers. Empathy and rapport produced the widest single behavioural difference in the entire dataset. Metric Top tier Bottom tier Difference Empathy and rapport 4.7 2.8 +68% Enthusiasm score +35% baseline +35% Exclamation count 2.4x baseline 2.4x A 68% difference on a single dimension is larger than what we found on question count, talk ratio, or actionable outcomes. For a CX leader at a 250-person company deciding where coaching hours go, empathy scoring higher than the criteria already on your rubric is a reason to add it to the rubric. The pattern repeats outside B2B sales. In our high-ticket wellness research, top-tier advisors scored 36% higher on emotional connection than bottom-tier advisors and enrolled 100% of patients where the bottom tier enrolled 33%, working the same programmes at the same prices. Want to see your own team’s empathy scores across every call? Start free What predicts empathy scores in real sales and support calls? Two things predict a high empathy score: whether the agent matched the customer’s language and pacing, and whether acknowledgement arrived at the moment of friction rather than at the end of the call. Timing carries more weight than volume. In our wellness consultation data, top advisors deployed empathy signals at specific friction points, when the patient raised a cost concern, a health anxiety, or frustration with a previous treatment. They acknowledged before solving. Bottom-tier advisors delivered the same sympathetic language, arriving after the recommendation, where it read as a formality. Where empathy sits among your other QA criteria Four categories cover most call evaluation rubrics: Weighting differs by team. A support floor handling billing complaints might put 40% of the score on empathy and resolution combined. A sales floor might split that same 40% between empathy and objection handling, since a rep who acknowledges the concern and then fails to address it has done half the job. But there is a real trade-off to know before you weight empathy heavily on a sales team. Research from Cambridge Judge Business School separates cognitive empathy, meaning the ability to understand the buyer’s perspective, from emotional empathy, meaning feeling what the buyer feels. Cognitive empathy improved pricing, sales volume and service quality together. Emotional empathy raised volume while pushing prices down, because reps who felt the buyer’s discomfort conceded on price to relieve it. What that means for your rubric: score whether the rep demonstrated understanding of the customer’s situation, rather than scoring how warm they sounded. The first predicts revenue while the second can cost you margin. The 4 A’s of customer empathy The 4 A’s are Acknowledge, Align, Assure, and Act. Each one produces a phrase pattern you can find in a transcript, which is what makes the framework usable as a scoring rubric rather than a training poster. Scoring criterion: did the agent restate the customer’s specific issue in their own words within the first 90 seconds? Scoring criterion: did the agent connect the customer’s reaction to their situation, rather than moving straight to policy? Scoring criterion: was the stated action completed or scheduled before the call ended? Some versions of this framework use Apologize in place of Align. We prefer Align for sales conversations, where there is often nothing to apologise for and an unnecessary apology weakens the rep’s position. Support teams handling service failures may want both. What empathy sounds like on a call Here are five patterns, one per moment, tied to the framework above. Adapt the wording to your brand voice rather than reading them verbatim, since scripted empathy scores worse than none. Notice that none of these say “I understand how you feel.” Generic sympathy statements score poorly on language style synchrony because they match nothing the customer said. A low-empathy call rarely ends in an immediate complaint. The customer simply resolves their issue and privately decides you are difficult to deal with, which shows up later as an escalation, a poor CSAT response, or a renewal that does not happen. The measurable version of that cost appeared in our wellness data. Bottom-tier consultations degenerated into advisor monologues running 80% or more of the talk time, and those advisors enrolled 33% of patients against 100% for the top tier. Same programmes, same pricing, same patient pipeline. Our insurance research found the same structure. Top-tier agents
Live Desk, Smarter Library Search, and Salesforce Integration
A new training mode checks whether reps can find the right answer under pressure, library search now answers plain-English questions, and Salesforce data can flow straight into Insight7.
80+ Sales Call Statistics for 2026 (Full Data & Sources)
Search “sales call statistics” and you will find the same numbers everywhere: dial counts, connect rates, cold email reply rates, how many follow-ups it takes before a prospect answers. These are useful information but all of it describes what happens before a conversation starts. What about what happens once someone picks up the phone? Contact centers and sales floors manually review a tiny slice of their calls, so nobody has enough data to publish. It’s why we scored 6,209 real sales conversations across 12 behavioral dimensions, then ran the same scoring model against hundreds more calls each in insurance, wellness, and manufacturing. What you see beloe is every figure from those four studies, organized by theme, plus sourced statistics from outside research that round out the picture. Conversation Behavior Statistics From 6,209 Scored Sales Calls (1-16) All figures below come from The DNA of High-Performing Reps, the first release in Insight7’s Call Analytics Index. How to use this: if you’re only going to coach toward one number this quarter, the data points to Actionable Outcomes, since it separates strong calls from average ones more than any other measured behavior. AI Coaching can turn a low Actionable Outcomes score into a targeted practice scenario automatically, rather than a generic note to “be more decisive on the call.” Close Rate Benchmarks by Industry (17-40) Industry Best-performing tier Weakest tier Widest gap Insurance (quote to bound policy) 65.4% close rate 0% Funnel Performance, 204% Wellness/health coaching (enrollment) 100% 33% Conversion & Close Execution, 48% Manufacturing (inbound quote to order) 29% placed an order 0% Conversion & Close Execution, 77% Cross-industry (all calls scored Excellent) 6.9% N/A N/A How to use this: Before investing coaching hours in product knowledge or scripting, check whether reps are reaching a genuine close attempt at all. Sales Coaching built around your team’s own close-attempt rate is a faster fix than a broader training overhaul. Sales Coaching Benchmarks From Real Call Data (41-50) How to use this: pick two or three of these targets, not all ten at once. Every one of the four Insight7 studies recommends fixing close-attempt behavior first, since coaching objection handling or product knowledge does little for a rep who never reaches the point where either skill gets used. AI Roleplays can build practice scenarios directly from a rep’s own scored gap rather than a generic script. QA Coverage and Call Sample Size Statistics (51-53) How to use this: if your QA program samples calls the traditional way, the honest question is whether 2-5% is even enough data to know what “normal” looks like on your floor. Tools like Insight7’s Call Quality Assurance scores every recorded call instead of a handful, which is the only way most of the gaps above ever get seen at all. Sales Quota Attainment and Coaching Frequency Statistics (59-66) How to use this: the weekly-versus-quarterly quota gap above is one of the largest in this entire roundup, and it costs nothing to test on your own floor. Assign a short, specific practice session to every rep every week without adding hours to a manager’s calendar. Insurance Shopping and Buyer Behavior Statistics (69-72) How to use this: a customer who has already compared two or three quotes before the phone rings has effectively started the call ahead of the agent. Naming specific carriers early is one of the few behaviors in this dataset directly aimed at closing that gap. Knowledge Access and Information-Search Statistics (74-75) How to use this: a rep who can’t find the right answer mid-call is living out these statistics in real time, usually while a customer waits. Use your AI knowledge base to surfacesanswers from your own company and product content during the call itself, rather than sending a rep hunting through five different tools. Where the Category Is Headed (80-83) How to use this: if your team fits that 50-100 range and you’re currently stitching together separate QA, coaching, and knowledge tools, Insight7 runs all three on one shared data layer, so a gap flagged in QA turns into a coaching scenario automatically instead of a manual handoff between systems. Every study above traces back to the same root cause: teams scoring 2-5% of their calls simply never generate enough data to publish. A 204% funnel gap or a 68% empathy gap only shows up once hundreds or thousands of conversations get scored the same way, which manual review was never built to do at that scale. Insight7’s Call Analytics Index exists to keep publishing this kind of data as new studies complete. To see where its own calls land against these benchmarks, start scoring your own conversations for free and compare the results directly. FAQs About Sales Call Statistics What percentage of sales calls result in a close? It depends heavily on industry and deal type. Insight7’s data shows top-performing insurance agents closing 65.4% of calls, top wellness advisors enrolling 100% of patients, and top manufacturing reps placing orders on 29% of inbound calls, all against a bottom tier at or near 0% in the same conditions. How many questions should a sales rep ask on a call? Across 6,209 scored conversations, top-tier reps averaged 14.3 questions per call against 10.4 for average reps. The coaching benchmark drawn from that data is 12 or more per call, with density (how evenly they’re spread through the conversation) mattering as much as the raw count. What percentage of calls do QA teams typically review? Most manual QA programs cover under 5%, according to McKinsey research, with accuracy on those reviewed calls running 70-80%. How often should sales reps be coached? Weekly coaching correlates with the highest quota attainment (76%) in MySalesCoach’s 2026 research, compared to 47% for reps coached quarterly or less. Only 28% of reps currently get coached that often.
What to Put on a Sales Call Scorecard (Free Template + Win-Rate Data)
Actionable outcomes separated top and average reps by 72.0%, problem resolution by 56.0%, and goal achievement by 53.8%. Here is what belongs on a sales call scorecard, how to weight it, and how to test it against your own win rates.
What Percentage of Calls Should Quality Assurance in a Contact Center Review?
Fifty agents, 44,000 calls a month, six reviews per agent. That is 0.68% coverage, and it is the entire evidence base behind your QA score. We break down what percentage of calls QA teams review today, how to pick a sample size for the question you are asking, and where AI quality assurance removes the tradeoff.
What Is a Good Talk-to-Listen Ratio on a Sales Call?
A 30 minute call where your rep speaks for 15 minutes and the buyer speaks for 15 looks like a clean 50/50 split. It can also be a 14 minute monologue with a Q&A stapled to the end. Here are the talk-to-listen ratio benchmarks from four Insight7 studies, and the metric that tells you which call you actually had.
How Many Questions Should a Rep Ask on a Sales Call?
Key points Ten discovery questions feels thorough but isn’t twenty a deposition? Reps trading notes land somewhere between the two and hedge, because the honest answer has always depended on whose call you happened to listen to. So, we scored 6,209 real sales conversations across 12 performance dimensions to replace that instinct with a measured figure. Top-tier reps asked 14.3 questions per call against 10.4 for average performers, at twice the density. What follows is where that number came from, what it looks like inside a balanced conversation, and the threshold to set for your own team. How many discovery questions do top sales reps ask? In our sales rep performance research, top-performing reps asked 14.3 questions per call. Average performers asked 10.4, and the coaching floor we drew from the data is 12 or more per call. Here is what the scoring showed across the 6,209 conversations: Metric Excellent tier Average tier Difference Questions per call 14.3 10.4 +37% Question density (per minute) 1.2 0.6 2x A 37% gap in question count sounds modest until you translate it into a quarter. A rep running 40 discovery calls a month is asking roughly 150 fewer questions than a top performer over the same period, which means 150 fewer chances to hear the budget constraint, the competing vendor, or the internal politics that decides the deal. The benchmark moves with the call type Applying one number to every conversation your team runs will penalise somebody unfairly. Insight7’s vertical studies show how wide the spread gets. Call type Top tier Bottom tier Benchmark B2B sales and CS (6,209 calls) 14.3 questions 10.4 (average) 12+ per call Insurance quote calls 7 questions, nearly 2 open-ended 3 questions, under 1 open-ended 7+, 2 open-ended Wellness consultations Fewer questions, sharper Generic or absent discovery 3+ open-ended in first 5 minutes Inbound manufacturing Discovery on 88% of calls Discovery on 20% of calls 6 specs confirmed before quoting Insurance sits at half the B2B benchmark because an inbound quote call runs shorter and the customer already knows what they want. The top-tier insurance agents in that study still opened a far wider conversation, generating 16.1 customer turns per call against 3.2 for the bottom tier. Note: A 5x participation gap is what separates a discovery call from a presentation with pauses. If your reps are averaging three or four customer turns, the buyer stopped contributing early and the rest of the call was a monologue. Sometimes the count is zero At a building materials manufacturer Insight7 studied, top reps ran project discovery on 88% of calls while bottom reps managed 20%. On four out of five calls, the bottom tier quoted or deferred without asking anything. The cost landed downstream. Quoting without confirming specifications produces returns, recuts and callbacks, so a skipped question generated work for the branch weeks later. Top reps confirmed six things before naming a price: None of that is difficult. It went uncoached because manual review at that manufacturer covered under 2% of calls, so nobody could see which reps were skipping it. Discovery question pacing and talk-to-listen ratio in top-performing calls Question density predicts call quality better than raw count, because it captures when the questions arrived rather than how many were asked. Top performers asked 1.2 questions per minute. Average performers asked 0.6. Twice the frequency across the same stretch of conversation changes what a rep learns and when. Say two reps are on a 30-minute discovery call and both ask 14 questions. The first works through a qualification list in the opening four minutes, then presents for 26. The second spreads questions across the full call, so the answer at minute 22 can still redirect the recommendation. That first rep simply locked in her pitch before the buyer mentioned the compliance requirement that kills the deal. Where talk-to-listen ratio comes in Question pacing and speaker balance move together. Excellent conversations in the study held a 1:1 speaker dominance ratio, close to equal. Poor conversations ran at 1:8, with the rep doing nearly all the talking. On Turn Balance Score, which measures how evenly speakers trade turns, Excellent calls scored 0.4 against 1.2 for Poor. Anything above 1.2 has stopped being a two-way conversation. Insight7’s wellness study found the same failure in sharper form. Bottom-tier consultations degenerated into 80%+ advisor talk time, and those advisors enrolled 33% of patients while top-tier advisors enrolled 100%. Same programmes and pricing, same patient pipeline. Odun Odubanjo, Insight7’s CEO, explained the pattern best: “The top reps don’t use questions to interrogate but to guide. They don’t dominate conversations, they balance those conversations. When reps dominate, they miss what matters. When they listen, they are able to lead the conversations better.” For a QA manager running a 40-agent insurance floor, this is the practical value of pacing data. Talk ratio is measurable on every recording without a human listening, which means you can spot the agent drifting toward 8:1 in week two rather than in the quarterly review. Why asking more discovery questions doesn’t always win the call More questions improve outcomes up to a point, and the type of question decides where that point sits. Neil Rackham and the Huthwaite research team’s analysis of more than 35,000 sales calls over 12 years makes this concrete. They found an inverse relationship between basic fact-finding questions and success, and recommended capping those at 3 to 5 per call. Top performers spent their question budget elsewhere, on implication and need-payoff questions that made the buyer articulate the cost of the problem. Background questions have a ceiling because the buyer gets nothing back for answering them. A rep asking how many seats you have, what your renewal date is, and who else is evaluating is collecting CRM fields. But one asking what happens to the quarter if the migration slips helps the buyer think. Harvard points the same direction on which questions carry weight when they identified four question types and found follow-ups the most powerful, because
Customer Service Conversation Sentiment Analysis: A Guide
Learn what customer service conversation sentiment analysis is and how it helps improve customer experience. See how Insight7 can help.
