
Focus Group Analysis: Best AI Analysis Tools for Market Researchers
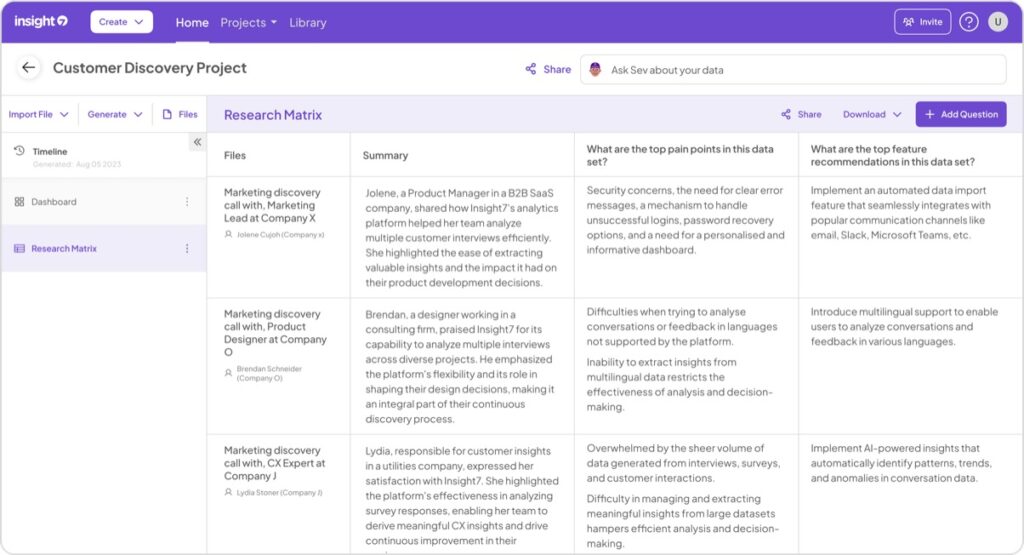
[vc_row type=”in_container” full_screen_row_position=”middle” column_margin=”default” column_direction=”default” column_direction_tablet=”default” column_direction_phone=”default” scene_position=”center” text_color=”dark” text_align=”left” row_border_radius=”none” row_border_radius_applies=”bg” overflow=”visible” overlay_strength=”0.3″ gradient_direction=”left_to_right” shape_divider_position=”bottom” bg_image_animation=”none”][vc_column column_padding=”no-extra-padding” column_padding_tablet=”inherit” column_padding_phone=”inherit” column_padding_position=”all” column_element_direction_desktop=”default” column_element_spacing=”default” desktop_text_alignment=”default” tablet_text_alignment=”default” phone_text_alignment=”default” background_color_opacity=”1″ background_hover_color_opacity=”1″ column_backdrop_filter=”none” column_shadow=”none” column_border_radius=”none” column_link_target=”_self” column_position=”default” gradient_direction=”left_to_right” overlay_strength=”0.3″ width=”1/1″ tablet_width_inherit=”default” animation_type=”default” bg_image_animation=”none” border_type=”simple” column_border_width=”none” column_border_style=”solid”][vc_column_text] Focus group analysis is a crucial component of market research, providing valuable insights into consumer opinions and behaviors. It is essential for result-oriented marketing. Focus groups offer valuable qualitative insights into consumer behaviors, preferences, and perceptions. The introduction of AI tools has transformed this process by offering greater efficiency, accuracy, and depth of insight. This article explores how AI is enhancing focus group analysis and provides a detailed overview of the top AI tools for market researchers in 2024. But before moving on, we should outline the process to give a better understanding of Focus group analysis: Data Collection and Preparation: Begin by collecting and preparing your data. This includes transcribing audio and video recordings and organizing notes accurately. Proper preparation ensures a smooth analysis process. Analysis: This stage involves multiple techniques to extract insights. You start by coding transcripts, assigning labels to relevant text. Then, you identify overarching themes. You might conduct sentiment analysis to gauge emotional responses., or content analysis to quantify specific topics. It is purely dependent on the type of analysis you want to do. Many researchers also do comparative analysis across groups and demographics. Advanced tools can even offer predictive analysis based on patterns in the data. Visualization: Once the analysis is complete, the next step is to visualize the findings. Effective visualization helps in conveying insights clearly and compellingly. Use charts, graphs, and infographics to represent data patterns and themes. Word clouds can highlight frequently mentioned terms, while bar charts or pie charts can illustrate the distribution of coded themes or sentiment scores. The Impact of AI on Focus Group Analysis AI tools address several key challenges in traditional focus group analysis: 1. Enhanced Speed and Efficiency: AI automates transcription, coding, and thematic analysis, allowing researchers to obtain insights more quickly and focus on strategic decisions. 2. Improved Accuracy: AI minimizes human errors in transcription and data coding, ensuring more reliable and consistent results. 3. Deeper Insights: AI algorithms identify patterns and themes that may not be immediately evident, offering richer and more actionable insights. 4. Scalability: AI efficiently handles large datasets, enabling comprehensive analysis without sacrificing quality. Essential AI Tools for Focus Group Analysis Here’s a detailed look at some of the most effective AI tools for focus group analysis, including their features, benefits, and potential drawbacks: 1. Insight7 Insight7 is a no-code SaaS platform designed for qualitative data analysis. It is designed to streamline the analysis of qualitative data with features like automated transcription, sentiment analysis, and theme identification. It offers powerful visualization tools, such as automated charts and graphs, which help in quickly visualizing trends and patterns. The sentiment analysis visuals provide a clear display of sentiment trends across data sets. Insight7’s user-friendly interface ensures that businesses can efficiently extract actionable insights from customer feedback and focus group data, making the analysis process both comprehensive, easy and straightforward. Key Features: Automated Transcription: Converts audio and video recordings into accurate text transcripts. Thematic Analysis: Identifies and extracts key themes and patterns from qualitative data. Customizable Reporting: Generates detailed and tailored reports based on focus group findings. Integration with Other Platforms: Seamlessly integrates with OneDrive, SharePoint, Gong, Google Drive, and more. Multi-Language Support: Analyzes data in various languages by translating it to English for processing and then back to the original language. Pros: User-friendly with a straightforward learning curve. Cost-effective compared to many competitors. Comprehensive end-to-end solution with flexible reporting and multi-language capabilities. Generates insights quickly Cons: Not suited for manual coding. 2. Delve Delve is a user-friendly qualitative data analysis tool that simplifies the process of coding and finding patterns in qualitative data, including focus group transcripts. It offers collaborative features for team analysis, making it easy for multiple researchers to work together. Delve’s intuitive coding process and visualization tools help teams quickly identify and communicate key insights from their data. Key Features: Advanced Coding: Offers dynamic coding and categorization options for detailed analysis. Thematic Visualization: Provides tools for mapping and analyzing themes effectively. Data Integration: Supports the integration of data from multiple sources. Collaborative Features: Enables multiple users to work on projects simultaneously. Pros: Strong coding and visualization features. Effective for team-based research projects. Good for detailed thematic analysis. Cons: Limited advanced analytical tools, Uses manual coding. 3. QuestionPro QuestionPro is a comprehensive survey and research tool that includes capabilities for conducting and analyzing focus groups. It offers features like automated transcription, qualitative data coding, and robust analytics. QuestionPro’s all-in-one platform allows for easy integration of survey and focus group data, and its powerful analytics tools help in generating comprehensive insights. Key Features: AI-Powered Insights: Utilizes advanced analytics to uncover insights from qualitative data. Survey Integration: Combines qualitative and quantitative data through seamless survey integration. Real-Time Reporting: Provides real-time updates and visualizations for immediate analysis. Customizable Dashboards: Tailors dashboards to specific research needs. Pros: Comprehensive tools for both survey and qualitative analysis. Real-time reporting enhances data visibility. AI-driven analytics offer actionable insights. Cons: Can be expensive, Some features may be more suited for survey data than in-depth qualitative analysis and advanced features may require additional training. 4. Taguette Taguette is a free, open-source tool for qualitative research. It allows researchers to code, annotate, and analyze text data, making it suitable for focus group analysis. While it has a basic interface, it is easy to use and provides the essential tools needed for basic qualitative analysis. Taguette’s open-source nature makes it an excellent choice for researchers on a budget or those looking for a customizable solution. Key Features: Tagging and Coding: Intuitive tagging and coding features for qualitative data. Customizable Categories: Allows for the creation of custom coding categories. Data Organization: Manages and organizes large volumes of data efficiently. Open-Source Flexibility: Offers customization options due to its open-source nature. Pros:
Best AI Tools for Qualitative Survey Analysis 2024

[vc_row type=”in_container” full_screen_row_position=”middle” column_margin=”default” column_direction=”default” column_direction_tablet=”default” column_direction_phone=”default” scene_position=”center” text_color=”dark” text_align=”left” row_border_radius=”none” row_border_radius_applies=”bg” overflow=”visible” overlay_strength=”0.3″ gradient_direction=”left_to_right” shape_divider_position=”bottom” bg_image_animation=”none”][vc_column column_padding=”no-extra-padding” column_padding_tablet=”inherit” column_padding_phone=”inherit” column_padding_position=”all” column_element_direction_desktop=”default” column_element_spacing=”default” desktop_text_alignment=”default” tablet_text_alignment=”default” phone_text_alignment=”default” background_color_opacity=”1″ background_hover_color_opacity=”1″ column_backdrop_filter=”none” column_shadow=”none” column_border_radius=”none” column_link_target=”_self” column_position=”default” gradient_direction=”left_to_right” overlay_strength=”0.3″ width=”1/1″ tablet_width_inherit=”default” animation_type=”default” bg_image_animation=”none” border_type=”simple” column_border_width=”none” column_border_style=”solid”][vc_column_text] Qualitative survey analysis continues to evolve, driven by rapid advancements in artificial intelligence (AI). This evolution has reshaped how organizations gather and interpret data from surveys, especially in industries like market research, customer insights, and product development. Traditionally, qualitative survey analysis was a time-consuming process, requiring manual sifting through open-ended responses to uncover insights. However, AI now offers a faster, more accurate way to extract valuable insights, allowing businesses to stay competitive and responsive to customer needs. AI tools can analyze vast amounts of unstructured survey data, transforming them into actionable insights in minutes. These tools use techniques like natural language processing (NLP) and sentiment analysis to understand complex feedback, helping businesses understand customer sentiments, detect trends, and make data-driven decisions. In this article, we will explore some of the best AI tools for qualitative survey analysis in 2024, their key features, and how they can transform the way you handle survey data. Whether you are a researcher looking to streamline data analysis, a business seeking deeper customer insights, or a product developer aiming to optimize user feedback, AI-powered tools can enhance the entire process. Let’s dive into why qualitative survey analysis is essential in 2024 and how AI tools are revolutionizing this space. Why Qualitative Survey Analysis with AI is Important in 2024 Qualitative survey analysis has always been crucial for understanding customers beyond numerical data. In the past, this type of analysis was often done manually, making it labor-intensive and prone to human error. Analysts had to read through hundreds, if not thousands, of open-ended responses, identifying themes, sentiments, and actionable insights. This process could take weeks or even months, delaying business decisions and limiting the ability to respond to customer needs in real time. However, AI is now transforming the way we approach qualitative survey analysis. With AI-powered tools, businesses can automatically analyze large datasets, quickly uncovering patterns and trends that might have been missed by human analysts. For instance, these tools can break down responses by sentiment, detect emerging themes, and generate comprehensive reports. This speed and efficiency allow businesses to act on insights almost instantly, providing a competitive edge in today’s fast-paced market. In 2024, adopting AI for qualitative survey analysis is no longer a luxury but a necessity. As customer feedback grows in volume and complexity, businesses need tools that can handle this data at scale and provide deeper insights. AI tools not only enhance accuracy and speed but also allow companies to continuously improve their products, services, and customer experiences. With AI, organizations can transform raw survey data into valuable knowledge that drives growth and innovation. AI Tools for Qualitative Survey Analysis 2024 Insight7 ChatGPT Qualtrics Hubspot SurveyMonkey Integration Thematic 1. Insight7 – Best for Comprehensive Qualitative Data Analysis Overview: Insight7 is a cutting-edge AI tool designed specifically for qualitative survey analysis. It automates the entire process of analyzing open-ended survey responses, providing businesses with actionable insights quickly and efficiently. With its advanced natural language processing capabilities, Insight7 helps companies uncover hidden patterns in survey data, enabling better decision-making. Key Features: Automated Qualitative Data Analysis: Insight7 automatically analyzes large volumes of qualitative data, identifying themes, sentiments, and key insights without manual effort. Bulk Transcription Capability: Allows users to transcribe and analyze multiple survey transcripts at once, saving time and resources. Comprehensive Reporting: Generates detailed reports with key findings, visualizing data trends and providing actionable insights. Enterprise-Grade Data Security: Adheres to industry-standard data security protocols, including GDPR and SOC2, ensuring the protection of sensitive customer information. Customizable Insight Deliverables: Users can customize the way insights are delivered, choosing from reports, journey maps, user personas, and more. Project-Based Research Repository: Stores and organizes survey data for easy access and collaboration across teams. Collaboration and Sharing: Allows teams to collaborate on insights in real-time, ensuring alignment across departments. Benefits: Insight7 is designed to save businesses time and effort by automating the analysis of open-ended survey responses. It excels in processing complex datasets, identifying key trends, and producing clear, actionable reports. The tool also ensures data security, making it a reliable choice for organizations handling sensitive customer feedback. 2. ChatGPT – Best for Natural Language Processing and Insight Generation Overview: ChatGPT is a powerful AI language model that excels in analyzing qualitative data by generating insights from open-ended survey responses. Its natural language processing capabilities allow it to understand context and extract themes effectively. Key Features: Text Analysis: Automatically analyzes and summarizes qualitative data, providing insights into common themes and sentiments. Generative Responses: Generates insightful responses and suggestions based on survey data, making it easier for teams to brainstorm ideas and strategies. Customization: Users can customize prompts to focus on specific areas of interest within the survey responses, tailoring the analysis to their needs. Interactive Feedback: Engages in conversation with users, allowing for iterative refinement of insights and deeper exploration of themes. Benefits: ChatGPT enhances qualitative survey analysis by enabling teams to quickly generate insights from complex data. Its conversational interface allows for more dynamic exploration of themes and issues identified in survey responses. 3. Qualtrics – Best for Advanced Data Visualization Overview: Qualtrics is a robust AI-powered tool known for its advanced data visualization capabilities, making it ideal for organizations looking to gain deeper insights from their qualitative survey data. The platform offers an intuitive interface and a comprehensive suite of tools for analyzing and visualizing survey results. Key Features: Text iQ: Uses natural language processing (NLP) to analyze open-ended survey responses, automatically detecting sentiment and key themes. Advanced Data Visualization: Converts qualitative data into interactive dashboards and visual reports, making insights easier to understand and share. Survey Customization: Users can design, distribute, and analyze surveys tailored to specific research needs. Integration with CRM Systems: Integrates with CRM platforms to allow businesses to
B2B Product Research: A Step-by-Step Guide

In B2B product research, your role is critical to the success of your organization. Conducting thorough research on competitors, emerging technologies, and customer needs will directly impact key business decisions and drive innovation. However, with countless data sources and research methodologies to consider, determining an effective approach can feel overwhelming. This guide provides a proven step-by-step process for conducting high-impact B2B product research. By following these steps, you will gain invaluable insights to shape product strategy, uncover new opportunities, and fuel growth. With the right process and tools in place, you have the power to propel your business into the future. Understanding Your Target B2B Customer To effectively research B2B products, you must first understand your target customer. This involves analyzing key details about the businesses and decision makers who may purchase your offering. Some factors to consider include: Firmographic Data Examine attributes like company size, industry, location, and annual revenue. Businesses with similar characteristics often have comparable needs and priorities. Identify the types of companies most likely to benefit from your product. Key Decision Makers Determine who within target companies has the authority to approve purchasing your product. This may be a C-level executive like the CEO or CTO, a director or manager in a relevant department, or a purchasing agent. Understand their motivations, pain points, and priorities. Business Challenges Ascertain the primary difficulties and inefficiencies faced by your target customers. Your product should provide a solution to these issues in a way that is cost-effective and impactful. Survey existing customers or conduct market research to identify shared problems across companies. Purchasing Criteria The factors that influence a B2B buying decision include cost, scalability, integration, support, and return on investment. Determine how target customers evaluate and select new tools or technology. Your product and marketing messages should explicitly address these key purchasing criteria. Competitive Landscape Analyze direct and indirect competitors to understand your target market better. Ask questions like: Who are the major players? What strengths and weaknesses do their products have? How can you differentiate your offering? Gaining a deep understanding of the competitive landscape will allow you to position your product for success. By thoroughly analyzing your target B2B customers, you gain essential insights to guide product development and marketing strategies. Craft a solution and messaging that directly addresses customer needs, priorities and buying criteria to achieve the best results. With diligent research, you can create a product that resonates strongly in the market. Defining the Product Requirements Defining the Product Requirements To effectively research B2B products, you must first define the key requirements and specifications for the product. This involves determining what features and functionality are necessities versus nice-to-haves. You will need to identify: •The primary purpose or goal of the product. What key objectives will it help your business achieve? Increased efficiency? Improved customer experience? Cost reduction? •The essential features the product must have to fulfill its primary purpose. For example, if improving operational efficiency is the goal, essential features may include automation, integration with existing systems, and reporting/analytics. •The target users of the product. Who in your organization will be directly using and interacting with the product? Their needs and technical proficiency will impact required features. •Any compliance or security standards the product must meet. For regulated industries or when handling sensitive data, the product will need to satisfy relevant requirements. •The product’s compatibility needs. Determine if it needs to integrate with existing infrastructure, software, databases or business processes in your organization. •Potential obstacles to product adoption. Consider challenges like lack of technical skills, budget constraints, or resistance to change that could impact rollout of a new product. Addressing these upfront will lead to a more successful implementation. •Budget parameters for the product. Though cost is often not the only factor, you must determine a reasonable budget range for solutions that would suit your needs. With a well-defined list of requirements and specifications in hand, you can then begin researching products that are the best potential match and fit for your organization’s needs. Conducting Market Research Conducting thorough market research is essential to developing a successful B2B product. As a product researcher, it is your responsibility to gain a deep understanding of your target market and customers. Follow these steps to conduct effective B2B product research: Identify your target market and customers Determine which businesses and decision-makers will be most interested in your product. Look at factors like company size, industry, location, and job titles. Create buyer personas to represent your key customers. Outline their demographics, behaviors, motivations, and buying objectives. Analyze the competition Examine similar products on the market. Compare features, benefits, pricing, positioning, and more. Look for gaps in the market that your product could fill. See what competitors are doing well and how you can differentiate. Monitor their product updates, marketing campaigns, and customer reviews. Conduct surveys and interviews Connect directly with members of your target market through surveys, phone interviews, and in-person meetings. Ask open-ended questions to understand their key challenges, priorities, and product needs. Incorporate their feedback into your product design and go-to-market strategy. Review industry reports and trends Research industry reports, news articles, and trend analyses to identify opportunities for innovation. Look for emerging technologies, shifts in customer expectations, regulatory changes, and other factors that could influence your product. Stay up-to-date with the latest developments in your industry. Analyze customer reviews Study reviews from existing solutions to determine what customers value most. Look for common complaints and suggestions for improvement. See what delights customers and what causes frustration. Aggregate these insights to build a superior product experience. Conducting rigorous B2B product research will validate your assumptions, reveal insights, and set you up for success. Gain a 360-degree view of your market and customers so you can develop a product that uniquely meets their needs. Continuous research will help your product evolve to match the changing priorities of your target market. Try this free tool to analyze and transcribe customer interviews. Analyzing Competitor Products To effectively analyze competitor
How to Conduct User Research for Maximum Value

User research is the process of understanding users’ needs, behaviors, and attitudes through different techniques. Conducting user research is crucial for product teams to build better products and services that meet their users’ needs and solve their problems. Whether you are launching a brand new product or redesigning an existing one, it is essential to engage with real users before you do anything else. If you skip this crucial step and dive straight into design and production, you are essentially basing your decisions on guesswork – a costly game to play. What if you bring your product to market only to find that you guessed wrong? You will have to go back to the drawing board, having unnecessarily wasted time, resources and money. User research conducted in the right way, at the right moment, is the only way to avoid this. Good design starts with thorough user research. Without sufficient research, it is impossible to distinguish between a product that merely looks good and one that solves a real user problem. What is User Research? User research is the process of understanding users’ pain points, desires and behaviors through various methods and techniques, including interviews, surveys, observations, usability tests, etc. It involves gathering insights from real users to inform the design and development of products or services. The process of conducting user research can be tedious and time consuming. In this blog post, we will introduce some key user research methods and how to get maximum value from your user research. Methods of Conducting User Research There are two types of user research methods: qualitative and quantitative research. Quantitative research yields measurable, numerical results, while qualitative research focuses on the reasons and motivations behind the user’s behavior. Quantitative research methods include surveys, analytics, and A/B testing. Surveys are a cost-effective way to gather data from a large sample of users. Analytics provide data on user behavior, such as click-through rates and conversion rates. A/B testing is a method of comparing two versions of a design to determine which one performs better. Qualitative research methods include interviews, focus groups, and usability testing. Interviews allow you to gather in-depth information about users’ attitudes, behaviors, and motivations. Focus groups are useful for testing new product concepts or ideas. Usability testing involves observing users interacting with a product to identify usability issues. How to Conduct User Interviews To extract maximum value from user research, it’s essential to follow a structured approach. 1.Define Your Research Goals Before starting the research process, it’s essential to define your research goals. What do you want to achieve through user research? What problems are you trying to solve? By defining your research goals, you can create a clear roadmap for the research process and ensure that you gather relevant data that helps you make informed decisions. 2. Identify Your Target Audience Once you have defined your research goals, you need to identify your target audience. Who are the users that you want to research? What are their demographics, behaviors, and attitudes? By identifying your target audience, you can tailor your research methods and questions to gather the most relevant data. 3. Choose the Right Research Methods There are different research methods you can use to gather data, including interviews, surveys, observations, and usability tests. Choosing the right research methods depends on your research goals and your target audience. For example, if you want to understand how users interact with your product, you can conduct usability tests to observe their behavior. If you want to gather insights into users’ attitudes and perceptions, you can use interviews or surveys. 4. Recruit Participants Recruiting participants is a crucial step in the research process. You need to identify the right participants who match your target audience criteria. You can recruit participants through different methods, including online recruitment, social media, or in-person recruitment. It’s important to ensure that your participants are representative of your target audience and that you have enough participants to gather sufficient data. 5. Conduct the Research Once you have recruited participants, it’s time to conduct the research. Make sure to follow a structured approach and ask open-ended questions that allow participants to express their thoughts and opinions freely. Use the research methods that you have chosen to gather data, and record the data in a structured way for analysis. You can read more about asking the right interview questions here. 6. Analyze the Data Conducting the research is the first major step. After conducting the research, you need to analyze the data to extract meaningful insights. This is a painstaking process for UX researchers because of the number of hours spent sorting and trying to make sense of the data. You can use different techniques to analyze the data, including content analysis, thematic analysis, or statistical analysis. It’s important to ensure that your analysis is unbiased and that you identify patterns and trends in the data that help you answer your research questions. AI powered tools like Insight7, automate the process and cut down research analysis time from hours to minutes. 7. Synthesize the Insights The final step is to synthesize the insights from the research. By synthesizing the insights, you can create a comprehensive understanding of your users’ needs, behaviors, and attitudes. You can use the insights to inform your product or service development, marketing strategies, and customer service initiatives. With Insight7, you can visualize themes, pain points, desires, behaviors and sentiments from your customer feedback in seconds, helping you gain a comprehensive understanding of the data. It also synthesizes insights and identifies priorities and opportunities from your research data, which helps you make product decisions faster. In conclusion, conducting user research is a critical step for businesses to create better products and services that meet their users’ needs. By following the steps outlined in this blog post, you can conduct user research for maximum value and make informed decisions that benefit your users and your business more efficiently.
Hypothesis Testing: How to do it the right way

“I believe that if we change the design of the landing page, it will lead to an improvement in signups”. In the regular, “normal” vocabulary of the natural world, the opening quote sentence is a passable hypothesis. However, in the world of product discovery, it is a terrible one. And the product discovery process will see a Product Manager formulate and make decisions based on hypothesis on an iterative basis. This is why we must conduct hypothesis testing the right way. But what is Hypothesis Testing? Simply put, Hypothesis Testing is a technique in product management that allows a product manager to validate their ideas about a product in the Product Discovery process. In hypothesis testing, after formulating a hypothesis, data gathering is done to test it. There are two types of hypotheses: null and alternative. The null hypothesis states that there is no difference or relationship between the two variables, while the alternative hypothesis states that there is a relationship or difference between the variables. At the beginning of this article, we introduced a hypothesis that we said was terrible. A correct hypothesis concerning the same scenario would be: So, let us break down the most important things to note when conducting Hypothesis Testing. Be Specific This is probably the most essential thing to note about hypothesis testing. For instance, the first thing to note in the first “bad” hypothesis we introduced was that the landing page redesign was loosely defined. What aspect of the landing page is being changed? The colors? The button placement? Also note that in the good hypothesis, the “impact” question of the hypothesis was practical and specific. According to Product expert Teresa Torres, saying a design change will “increase usability” is not specific enough. Why? Because it is not measurable. The same goes for hypothesizing an increase in engagement. Engagement, though measurable, is still not specific enough. Will it increase the time spent on the site? The number of button interactions? The email signups? Product Managers should also note that targeting your hypothesis to a specific group of people is the only way to truly narrow it down to a measurable metric. Like the example in the diagram above, simply saying “design change x should…increase conversion of users” is not enough. What type of users are you targeting with this design change? Are you targeting seasoned experts? Or power users? Or first-time users? Is a user already utilizing a competitor’s product? Being specific in hypothesis testing also involves measuring the best-guess degree of improvement the design change could provide for your product. This is often not more than guesswork, but if done right, it could make a world of difference between what design changes are thrown out and which ones are kept. For instance, if the degree of improvement expected from the hypothesis being tested is a 10 percent increase in conversion rate, then a 9 percent increase should denote a failure. This might seem extreme, but it helps protect your product from biases and mediocrity and might even inform your future estimates of what an acceptable expectation of improvement should be. Finally, we should define the duration of the hypothesis being tested. This protects the product team from losing track of the data or identifying false positives where there are none. The hypothesis should have a finite timeline that lets the product team come back to the drawing board and compare ideas again. Determine the Appropriate Sample Size Sample size is another essential factor in hypothesis testing. A sample size that is too small can lead to inaccurate results, while a sample size that is too large can lead to a waste of resources. It is essential to determine the appropriate sample size when conducting hypothesis testing to ensure accurate results. A larger sample size increases the chances of obtaining accurate data and decreases the chances of making mistakes when analyzing the data. Conduct Continuous Testing Continuous testing is crucial in hypothesis testing. It enables product managers to keep testing their hypotheses throughout the product development process to ensure they are on the right track. Continuous testing helps product managers to identify and address any issues early before they become significant problems. It also enables product managers to adjust their strategies in response to changing circumstances. Use the Right Statistical Tools Product managers should use the right statistical tools when conducting hypothesis testing. Statistical tools enable product managers to analyze data and draw conclusions from it. The choice of statistical tools depends on the type of hypothesis being tested and the sample size. Product managers should seek the guidance of statistical experts when choosing the right tools. Collaborate with Other Teams Hypothesis testing is a collaborative process that involves different teams in an organization. Product managers should work closely with teams such as marketing, engineering, and design to conduct successful hypothesis testing. Collaboration helps to ensure that all teams are aligned in terms of goals, objectives, and timelines. It also helps to ensure that all teams have a stake in the product’s success. Love the article? Read more about Product Discovery Basics For Building Better Products
How To Collect Data For Research

Data is one of the most valuable resources today’s businesses have. The more information you have about your customers, the better you can understand their interests, wants, and needs. This enhanced understanding helps you meet and exceed your customers’ expectations and allows you to create messaging and products that appeal to them. In this article, you’ll see the things you must do before you start collecting data and you’ll also see how to actually collect the data you need. How to Collect Data in 5 Steps There are many different techniques for collecting different types of quantitative data, but there’s a fundamental process you’ll typically follow, no matter which method of data collection you’re using. This process consists of the following five steps. 1. Determine What Information You Want to Collect The first thing you need to do is choose what details you want to collect. You’ll need to decide what topics the information will cover, who you want to collect it from and how much data you need. Your goals — what you hope to accomplish using your data — will determine your answers to these questions. As an example, you may decide to collect data about which type of articles are most popular on your website among visitors who are between the ages of 18 and 34. You might also choose to gather information about the average age of all of the customers who bought a product from your company within the last month. 2. Set a Timeframe for Data Collection Next, you can start formulating your plan for how you’ll collect your data. In the early stages of your planning process, you should establish a timeframe for your data collection. You may want to gather some types of data continuously. When it comes to transactional data and website visitor data. For example, you may want to set up a method for tracking that data over the long term. If you’re tracking data for a specific campaign, however, you’ll track it over a defined period. In these instances, you’ll have a schedule for when you’ll start and end your data collection. 3. Determine Your Data Collection Method At this step, you will choose the data collection method that will make up the core of your data-gathering strategy. To select the right collection method, you’ll need to consider the type of information you want to collect, the timeframe over which you’ll obtain it and the other aspects you determined. We’ll go over various methods you can use in the next section of this article. 4. Collect the Data Once you have finalized your plan, you can implement your data collection strategy and start collecting data. You can store and organize your data in your DMP. Be sure to stick to your plan and check on its progress regularly. It may be useful to create a schedule for when you will check in with how your data collection is proceeding, especially if you are collecting data continuously. You may want to make updates to your plan as conditions change and you get new information. 5. Analyze the Data and Implement Your Findings Once you’ve collected all of your data, it’s time to analyze it and organize your findings. The analysis phase is crucial because it turns raw data into valuable insights that you can use to enhance your marketing strategies, products and business decisions. You can sort your data and generate insights using Insight7 insight dashboard. 6 Ways to Collect Data So, how do you go about collecting the data you need to meet your goals? There are various methods of collecting primary, quantitative data. Some involve directly asking customers for information, some involve monitoring your interactions with customers and others involve observing customers’ behaviors. The right one to use depends on your goals and the type of data you’re collecting. Here are some of the most common types of data collection used today. 1. Surveys Surveys are one way in which you can directly ask customers for information. You can use them to collect either quantitative or qualitative data or both. A survey consists of a list of queries respondents can answer in just one or two words and often gives participants a list of responses to choose from. You can conduct surveys online, over email, over the phone or in person. One of the easiest methods is to create an online survey you host on your website or with a third party. You can then share a link to that survey on social media, over email and in pop-ups on your site. 2. Online Tracking Your business’ website, and your app if you have one, are excellent tools for collecting customer data. When someone visits your website, they create as many as 40 data points. Accessing this data allows you to see how many people visited your site, how long they were on it, what they clicked on and more. Your website hosting provider may collect this kind of information, and you can also use analytics software. You can also place pixels on your site, which enables it to place and read cookies to help track user behavior. 3. Transactional Data Tracking Whether you sell goods in-store, online or both, your transactional data can give you valuable insights about your customers and your business. You may store transactional records in a customer relationship management system. That data may come from your web store, a third party you contract with for e-commerce or your in-store point-of-sale system. This information can give you insights about how many products you sell, what types of products are most popular, how often people typically purchase from you and more. 4. Online Marketing Analytics You can also collect valuable data through your marketing campaigns, whether you run them on search, webpages, email or elsewhere. You can even import information from offline marketing campaigns that you run. The software you use to place your ads will likely give you data about who clicked on your ads, what
