

Survey Journey Visualization is rapidly becoming an essential practice for businesses seeking to enhance their understanding of customer experiences. As organizations increasingly rely on open-ended surveys to gather qualitative data, the ability to visualize these complex insights transforms them from mere text into actionable narratives. This visualization not only highlights key touchpoints but also uncovers pain points that can hinder customer satisfaction.
In a world where customer expectations are constantly evolving, understanding each step of their journey can provide invaluable insights. Effective Survey Journey Visualization allows businesses to interpret and showcase customer feedback dynamically, fostering better communication and informed decision-making. By leveraging advanced AI tools, organizations can turn raw survey data into clear, visual representations, making it easier to identify trends and improve overall customer interactions.
In this section, we will explore how artificial intelligence (AI) is revolutionizing the way we visualize journey maps derived from open-ended survey responses, a key aspect of turning qualitative data into actionable insights.
Artificial intelligence is fundamentally changing how we approach survey journey visualization, particularly when dealing with open-ended responses. Traditional methods often involved time-consuming manual analysis, making it challenging to extract meaningful insights. AI algorithms can swiftly analyze vast amounts of text data, uncovering patterns that might go unnoticed in human assessments. As a result, businesses can visualize these journey maps more effectively, revealing the intricacies of customer experiences.
By leveraging AI, organizations can transform qualitative data into actionable insights, presenting them in visually engaging formats. These visual maps highlight key customer pain points and expectations, empowering businesses to make informed decisions. The integration of AI tools enables a more nuanced understanding of customer journeys, facilitating better strategies for user satisfaction and engagement. As this transformation continues, the potential for more robust and targeted customer insights will expand, shaping the future of how businesses interact with their clientele.
AI Tools for Enhanced Survey Journey Visualization
AI tools play a pivotal role in enhancing survey journey visualization by transforming qualitative data into meaningful insights. Through the use of advanced algorithms, these tools sift through extensive open-ended survey responses, identifying key trends and patterns that may otherwise go unnoticed. This capability not only streamlines the process of visualizing customer journeys but also enriches the understanding of user experiences.
Effective survey journey visualization involves presenting complex data in an accessible and visually appealing manner. AI tools help create intuitive visual representations, allowing businesses to pinpoint pain points and areas of improvement throughout the customer journey. By integrating these technologies, organizations can harness powerful data-driven insights to inform their strategies and decision-making processes. As survey journey visualization continues to evolve, embracing AI tools can lead to significant enhancements in understanding and addressing customer needs.
In this section, well discuss how AI tools can significantly enhance the process of survey journey visualization.
AI tools are transforming survey journey visualization, which is essential for understanding customer experiences. By analyzing open-ended survey responses, these tools streamline the data interpretation process, enabling organizations to identify key trends and insights that might otherwise go unnoticed. The power of AI lies in its ability to handle vast amounts of qualitative data, making it easier to create clear and informative visuals of customer journeys.
These AI tools can categorize feedback into meaningful segments, thereby simplifying visualization. For instance, they can highlight positive and negative sentiments, allowing businesses to focus on critical areas of improvement. The visualization process becomes not just about data representation but also about storytelling, where businesses can see the complete narrative of customer interactions and draw actionable conclusions. This evolution of survey journey visualization enables companies to make informed decisions, ultimately enhancing their offerings and overall customer satisfaction.
The Role of AI in Mapping Customer Journeys
Artificial intelligence plays a crucial role in mapping customer journeys, especially when it comes to Survey Journey Visualization. AI technologies can analyze vast amounts of open-ended survey data, quickly identifying trends and patterns that would be labor-intensive for a human analyst. This capability allows businesses to gain deeper insights into customer experiences, optimizing their journey mapping efforts for greater effectiveness.
Utilizing AI in this context streamlines the process of extracting meaningful insights from qualitative feedback. By transforming complex data into clear visual representations, organizations can pinpoint key pain points and needs within the customer journey. This visibility enables businesses to make data-driven decisions that enhance customer satisfaction and drive strategic improvements. Through these advanced tools, companies gain a competitive edge, ultimately delivering better experiences tailored to their customers' expectations.
Here, well break down how AI technologies can sift through large volumes of open-ended feedback to identify trends and patterns, simplifying the visualization process.
AI technologies play a pivotal role in managing vast quantities of open-ended feedback, making it easier to identify trends and patterns in survey responses. These technologies utilize natural language processing (NLP) to analyze text data, extracting key themes and sentiments efficiently. By automating this process, businesses can uncover insights that would otherwise require extensive manual coding and analysis, minimizing both time and human error.
Moreover, AI facilitates the creation of visual representations of these insights, simplifying the journey mapping process. Users can easily interpret complex data, transforming abstract feedback into clear visualizations that highlight customer experiences. This transformation not only enhances understanding but also empowers organizations to make informed decisions based on accurate, data-driven insights. In doing so, AI serves as an essential tool for enhancing survey journey visualization.
Data-Driven Insights from Open-Ended Surveys
Data-driven insights from open-ended surveys provide a powerful means to understand and visualize customer experiences. Transforming unstructured feedback into meaningful visuals, businesses can better interpret the motivations and sentiments of their clients. This process involves the clever use of AI tools that can analyze textual data and highlight trends, ultimately shaping more informed strategic decisions.
By utilizing advanced algorithms, these tools can dissect open-ended responses to identify recurring themes and sentiments. For instance, they can differentiate between positive and negative feedback, enabling organizations to swiftly address concerns or celebrate successes. Such insights not only streamline survey journey visualization but also make the customer experience more transparent, ensuring that businesses remain responsive to their audience's needs. Ultimately, these data-driven approaches equip organizations with essential knowledge to enhance their offerings and strengthen customer relationships.
Well explore how AI can allow businesses to transform qualitative data into clear, visual journey maps, making it easier to understand customer experiences.
AI technology can significantly enhance how businesses visualize customer journeys using data from open-ended surveys. By processing qualitative insights, these advanced tools create clear, visual journey maps that outline customer experiences. This transformation allows organizations to identify key pain points, needs, and recommendations throughout the customer lifecycle.
Additionally, powerful AI algorithms can uncover underlying patterns in customer feedback that would be difficult to detect manually. As a result, businesses gain richer insights that facilitate better decision-making and targeted strategies. Visualizing survey journey maps not only clarifies complex data but also ensures that decision-makers focus on what truly matters to their customers. By harnessing the capabilities of AI, organizations can turn qualitative insights into actionable strategies, ultimately driving customer satisfaction and loyalty.
Top AI Tools for Visualizing Survey Journey Maps
In the realm of Survey Journey Visualization, various AI tools stand out for their ability to decode complex data into understandable, actionable insights. Each tool offers a unique approach to processing open-ended survey feedback, helping organizations identify trends and visualize customer experiences effectively. Utilizing these AI solutions can significantly elevate the understanding of customer journeys, ultimately aiding in strategy formulation.
Firstly, tools like Tableau provide robust data visualization capabilities and cater to intricate journey mapping needs. Power BI is another excellent choice, streamlining the visualization process with its comprehensive features tailored for survey data. Meanwhile, platforms like Qualtrics and Dovetail specialize in extracting valuable insights from qualitative data, allowing for deeper analysis of customer feedback. Finally, SentiSum leverages AI to transform text data into structured insights perfect for effective visual representation. By considering these tools, businesses can enhance their approach to Survey Journey Visualization, leading to improved strategies and customer engagements.
This section aims to provide a detailed list of powerful AI tools specifically designed to efficiently visualize journey maps from complex survey data.
To enhance Survey Journey Visualization, several powerful AI tools can efficiently transform complex survey data into clear and actionable visual maps. These tools are specifically designed to simplify the journey mapping process, making the analysis of qualitative data more manageable. By utilizing advanced algorithms, they can quickly sift through large volumes of open-ended feedback to identify trends, patterns, and significant themes that emerge from customer responses.
Among the leading tools, Insight7 stands out with its capacity to create intuitive visual representations from qualitative survey data. Its capabilities allow businesses to pinpoint customer pain points and needs easily. Other noteworthy tools include Tableau, which excels in data visualization, and Power BI, renowned for streamlining survey data processing. Qualtrics offers specialized features tailored for journey mapping, while Dovetail enables deep qualitative data analysis to provide visual insights. Lastly, SentiSum converts text data into structured insights, facilitating effective visualization of survey results. Embracing these AI tools can significantly enrich an organization’s understanding of customer experiences.
Insight7 – Leading AI Tool for Journey Mapping
The leading AI tool for journey mapping excels in transforming open-ended survey data into insightful visualizations. Users of this platform can easily access tools that help visualize complex data sets without needing expertise. This accessibility ensures that everyone in an organization can participate in understanding customer experiences more deeply.
By leveraging advanced algorithms, the tool not only identifies key themes and pain points within the data but also presents them visually, making analysis straightforward. It simplifies the journey mapping process by allowing users to extract actionable insights effortlessly. This capability is particularly beneficial for businesses that rely on survey journey visualization to refine their customer experience strategies. Overall, it serves as a robust solution for organizations aiming to elevate their understanding of customer interactions and improve their service delivery.
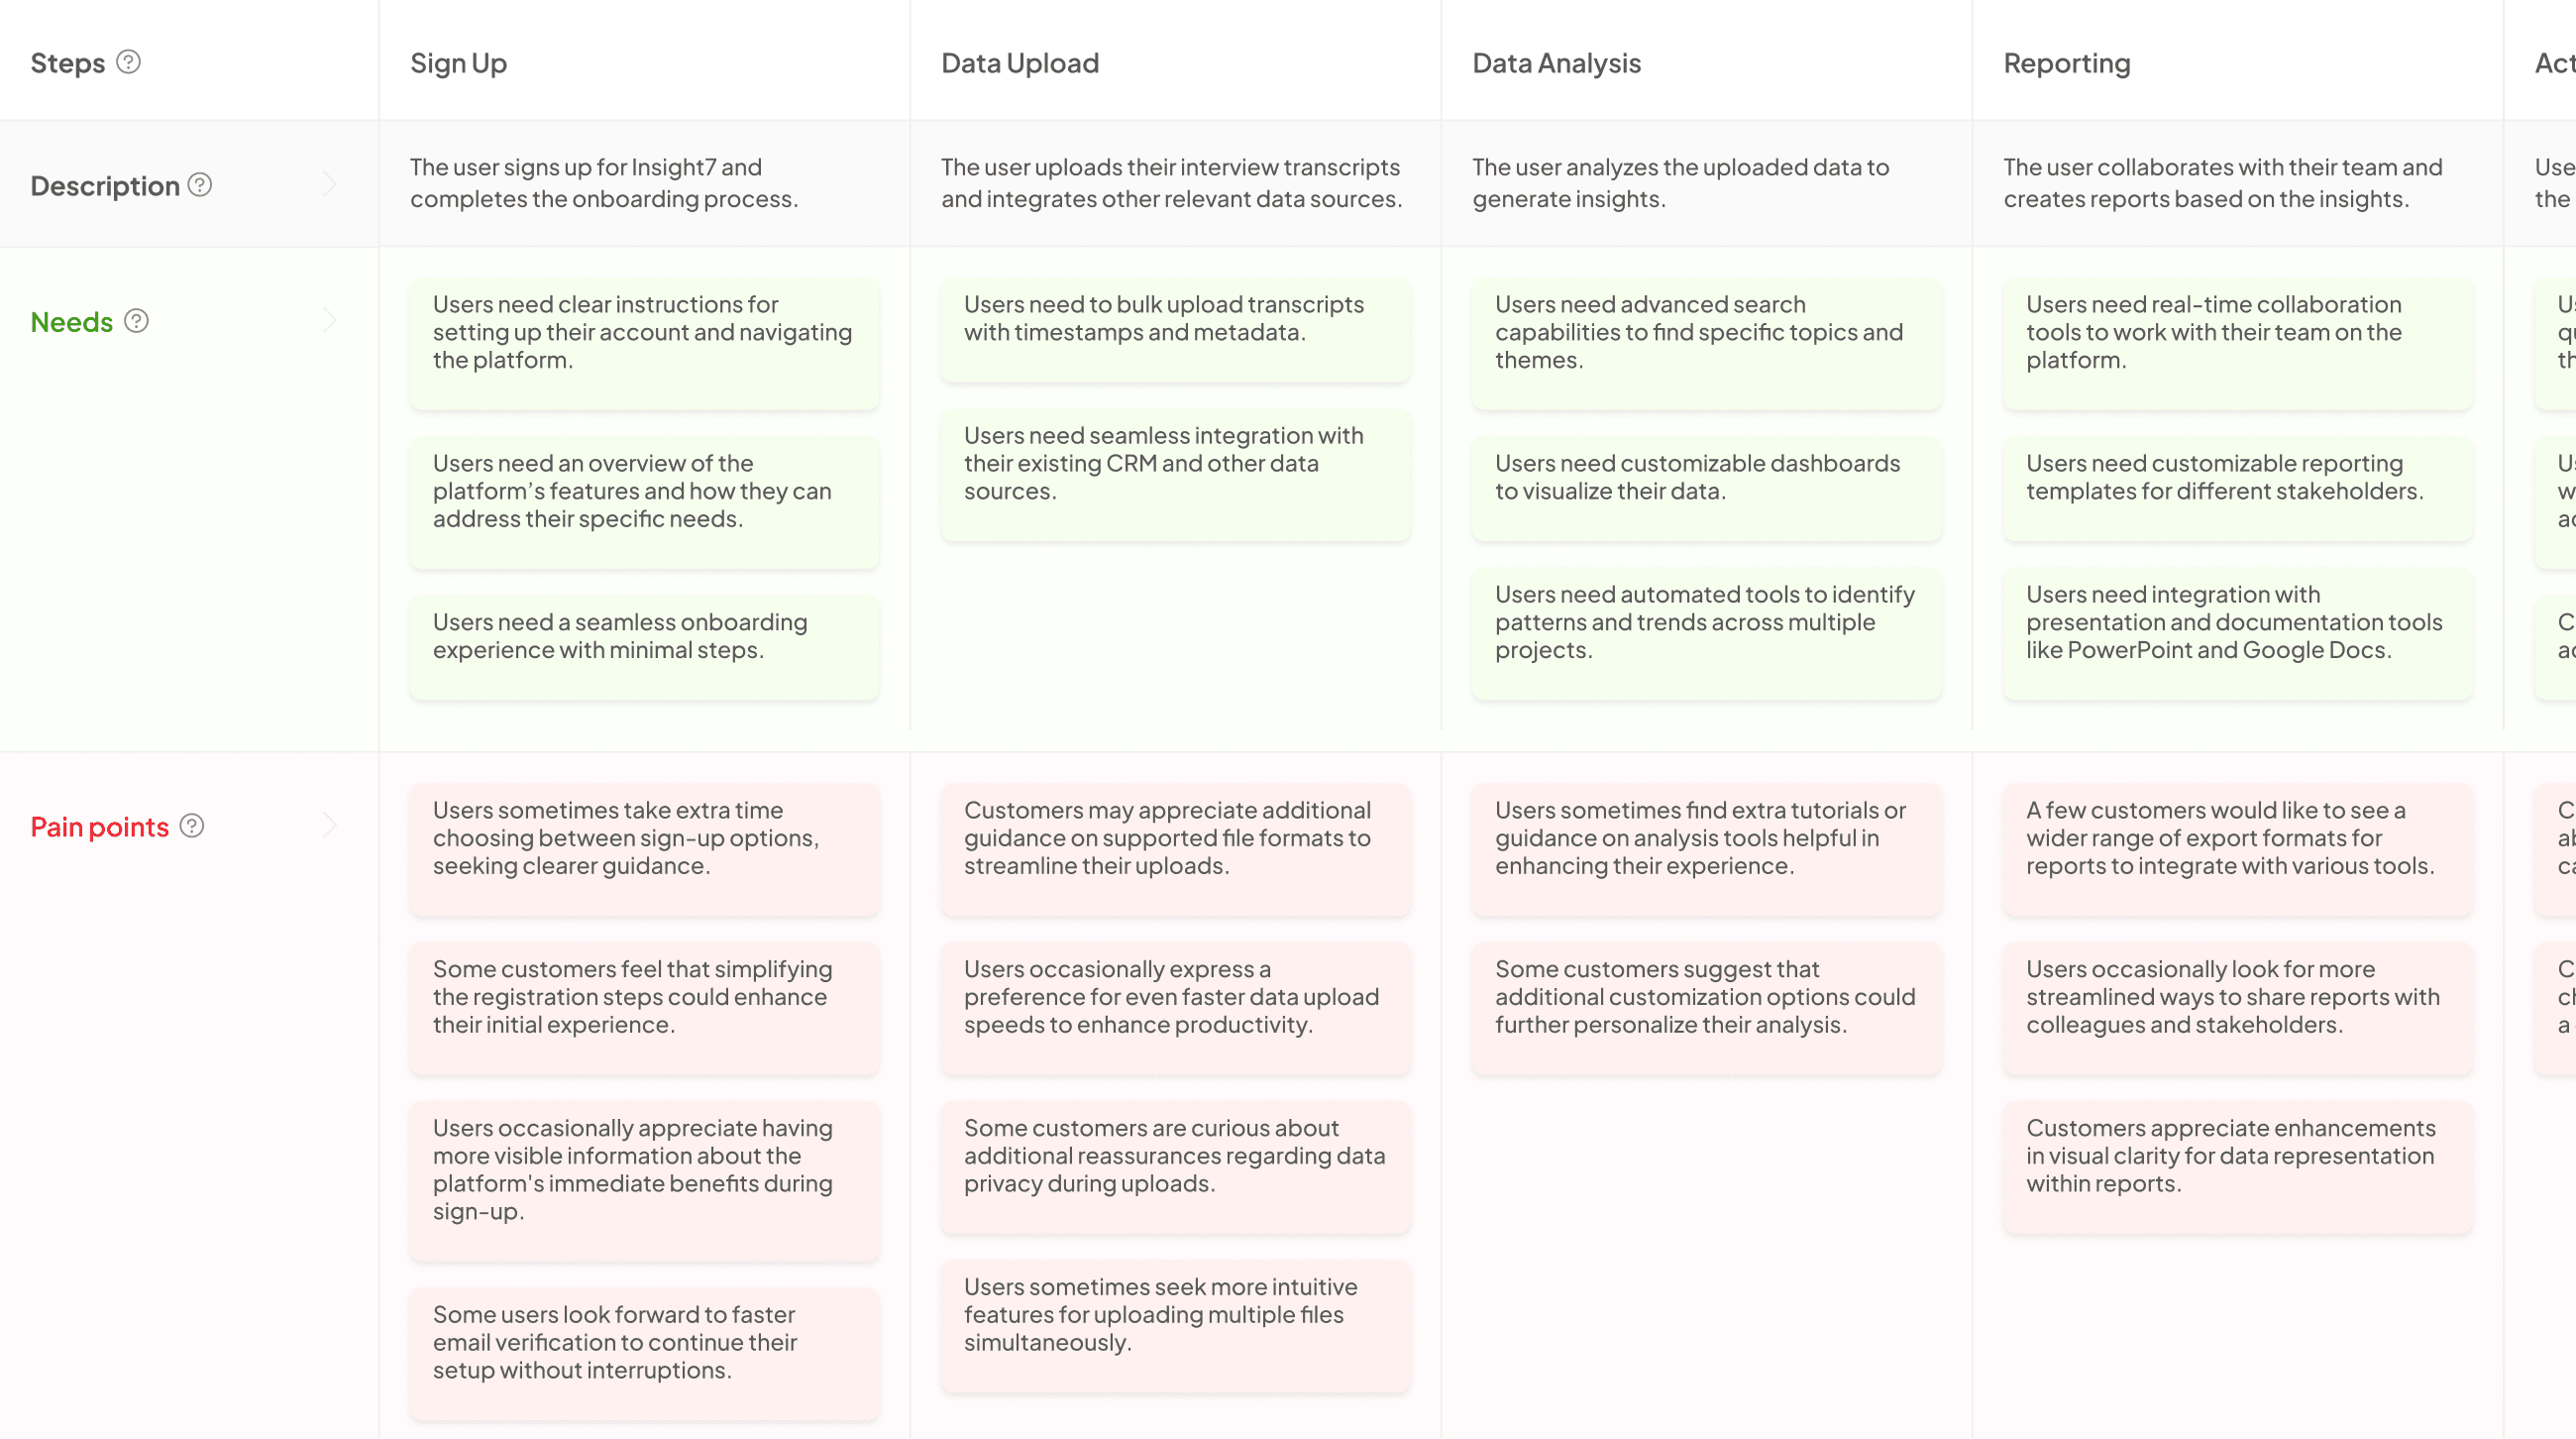
Insight7 is at the forefront, offering advanced capabilities to transform open-ended survey data into intuitive and actionable visual journey maps.
At the forefront of transforming open-ended survey data into engaging visuals, innovative technology is redefining how businesses handle customer insights. By generating intuitive and actionable visual journey maps, this approach allows organizations to truly understand customer experiences. The ability to sift through qualitative data seamlessly means that companies no longer must manually analyze interviews and feedback, which can be both time-consuming and inefficient.
Survey journey visualization plays a crucial role in converting scattered insights into cohesive narratives. This enables teams to collaborate effectively and drive strategies based on real customer signals. With technology advancing and the volume of customer interactions growing, organizations that harness these capabilities can stay ahead of their competitors, adapting to evolving needs and making informed decisions based on clear visual representations of their data. This shift empowers businesses to transform insights into actionable strategies, fostering a deeper connection with their customers.
Other Noteworthy AI Tools
In the realm of survey journey visualization, various noteworthy AI tools stand out, each offering unique functionalities. Among them, Tableau excels with its extensive data visualization capabilities, allowing users to transform complex survey data into clear and engaging journey maps. The visualizations can help highlight customer experiences effectively and provide critical insights for strategic decisions.
Power BI, another major player, integrates seamlessly with Microsoft platforms. It streamlines the process of visualizing survey data, enabling organizations to easily create meaningful journey maps. Qualtrics also specializes in journey mapping from survey results, providing tailored features ideal for understanding customer pathways. Furthermore, Dovetail emphasizes qualitative data analysis, producing visually appealing representations of customer insights. Lastly, SentiSum employs AI to convert unstructured text data into structured insights, further enhancing the visualization of survey results. Together, these tools empower businesses to derive actionable insights from open-ended surveys, enhancing their journey mapping capabilities.
- Tableau: Known for its robust data visualization capabilities, making it a valuable tool for journey mapping.
Tableau offers unique data visualization capabilities that enhance survey journey visualization by transforming complex data into easily interpretable graphics. This tool excels at representing intricate relationships and trends found within open-ended survey responses. Users can visualize various aspects of customer journeys, from initial research stages to post-purchase experiences, identifying friction points and key insights along the way.
What sets Tableau apart is its ability to display comprehensive journey maps, allowing businesses to pinpoint customer needs and pain points with clarity. By using a combination of charts, graphs, and interactive dashboards, organizations can tackle and resolve issues effectively. Ultimately, Tableau not only facilitates enhanced comprehension of customer experiences but also directs actionable strategies for improvement, making it a vital asset for any company engaging with survey data.
- Power BI: Microsofts comprehensive tool that helps streamline the process of visualizing survey data.
Power BI stands out as a comprehensive tool designed specifically for streamlining the visualization of survey data. Its intuitive interface allows users to transform complex datasets into visually appealing reports and dashboards. This capability plays a vital role in the process of Survey Journey Visualization, helping organizations interpret qualitative data effectively.
Users can connect to various data sources, enabling them to extract insights and identify patterns in open-ended survey responses. By utilizing drag-and-drop features, exploring diverse visualization options, and customizing reports, businesses can create detailed journey maps that illustrate customer experiences clearly. Furthermore, Power BI's ability to integrate AI functionality offers advanced analytical features, facilitating deeper understanding and actionable insights derived from survey feedback. In essence, Power BI provides a powerful platform for organizations looking to enhance their Survey Journey Visualization processes, making their data more accessible and meaningful.
- Qualtrics: Offers specialized features for journey mapping from survey results.
Qualtrics offers specialized features for journey mapping from survey results. This platform is designed to transform open-ended survey responses into clear visualizations that highlight customer paths. Users can map out the entire customer experience, from initial research phases to post-purchase evaluations. By analyzing survey results, this tool effectively identifies pain points and moments of friction throughout the journey.
The journey mapping capabilities allow businesses to make data-driven recommendations to enhance customer experience. For example, visual displays of customer feedback can clarify areas where interventions may be necessary, helping teams to understand needs and expectations more fully. This emphasis on Survey Journey Visualization empowers organizations to move beyond traditional analytics and embrace narrative-driven insights. Ultimately, it enhances strategic decision-making by providing a comprehensive view of the customer journey that is informed by qualitative data.
- Dovetail: Facilitates deep analysis of qualitative data, providing powerful visuals for customer journey insights.
In the realm of survey journey visualization, understanding qualitative data is paramount for insightful decision-making. With advanced analytical capabilities, this tool excels in dissecting open-ended survey responses, revealing trends and patterns that capture the essence of customer experiences. Users can aggregate vast amounts of qualitative data efficiently, enabling them to discern key pain points and moments of delight in the customer journey.
Furthermore, the power of visual representation transforms these insights into easily digestible formats. By generating impactful visuals, businesses can illustrate the diverse stages of the customer journey, from initial interactions to long-term advocacy. This method not only clarifies complex data but also enhances collaboration among teams by providing a shared understanding of customer sentiments. Ultimately, utilizing advanced analysis tools ensures that organizations can leverage customer feedback effectively, paving the way for informed strategies and improved customer relationships.
- SentiSum: Uses AI to convert text data into structured insights, ideal for visualizing survey results.
In the realm of Survey Journey Visualization, the utilization of advanced AI tools showcases remarkable potential in turning unstructured text data into structured insights. By transforming user comments and feedback from surveys into actionable intelligence, organizations can enhance their understanding of customer experiences. This capability allows teams to uncover the underlying sentiments and pain points within the data, illuminating the path customers journey through their services.
The process begins by analyzing open-ended survey responses, where AI swiftly identifies key themes and sentiments. Once recognized, these insights are organized into easily digestible formats, such as visual graphs or summarized insights. This structured approach not only facilitates clearer communication within teams but also empowers decision-makers to act based on real customer feedback. By harnessing such AI tools effectively, businesses gain a competitive edge in creating more informed and personalized customer experiences.
Conclusion on Survey Journey Visualization
In conclusion, Survey Journey Visualization offers businesses a transformative way to interpret open-ended survey responses. By utilizing advanced AI tools, companies can visualize complex customer experiences through clear journey maps. This enables them to identify pain points and moments of friction effectively.
AI empowers organizations to transform qualitative data into actionable insights, making it easier to understand customer needs. Embracing this technology leads to informed decision-making and ultimately enhances the customer experience. As businesses leverage these visualization tools, they pave the way for data-driven strategies that foster stronger connections with their audience.
By embracing these AI tools, businesses can effectively convert open-ended survey responses into insightful journey maps, enhancing their understanding of customer experiences and driving strategic decision-making.
Embracing AI tools for survey journey visualization enables businesses to unlock valuable insights from open-ended survey responses. These innovative technologies analyze qualitative data, revealing patterns and trends that may not be immediately obvious. By transforming complex feedback into visual formats, companies gain a clearer perspective on customer experiences, enhancing their strategic decision-making.
Using AI, businesses can effectively map customer journeys, identifying critical touchpoints and emotional responses. This process not only helps visualize the customer experience but also drives actionable insights that inform product development and marketing strategies. The ability to swiftly derive meaningful information from vast amounts of textual data ensures businesses remain competitive, fostering a culture of adaptability and responsiveness to customer needs. In combination, these tools empower organizations to enhance their understanding of consumer behavior, ultimately leading to stronger relationships and improved services.


