


Stakeholder Journey Visualization serves as a powerful tool for understanding the experiences and perspectives of those involved in a project. It transforms qualitative insights gleaned from stakeholder interviews into a visual format, allowing teams to identify pain points and opportunities for improvement. Crafting a journey map enables organizations to depict not just the steps stakeholders take but also the emotions they experience throughout their interactions.
Effective stakeholder journey visualization guides project teams in prioritizing user needs and refining strategies. By capturing the journey visually, teams can better communicate findings, align on objectives, and foster a collaborative approach. This section aims to equip you with the foundational knowledge required to create impactful visualizations that resonate with your stakeholders and drive actionable insights.
Understanding the Importance of Stakeholder Journey Visualization
Stakeholder journey visualization plays a crucial role in enhancing understanding of user experiences. By visually representing the journey taken by stakeholders, we can identify friction points they encounter. This process enables teams to empathize with users, recognizing their needs and pain points effectively. Visualizing these journeys transforms abstract data from interviews into concrete narratives, allowing for better insights into stakeholder experiences.
The significance of journey visualization cannot be overstated. It fosters collaboration among team members and helps stakeholders communicate their insights more clearly. Furthermore, it creates a shared understanding that can lead to actionable recommendations. When stakeholders see their journey laid out visually, it becomes easier to pinpoint potential improvements, ensuring that efforts are aligned with user expectations. Ultimately, effective stakeholder journey visualization enhances the likelihood of delivering meaningful solutions and experiences tailored to user needs.
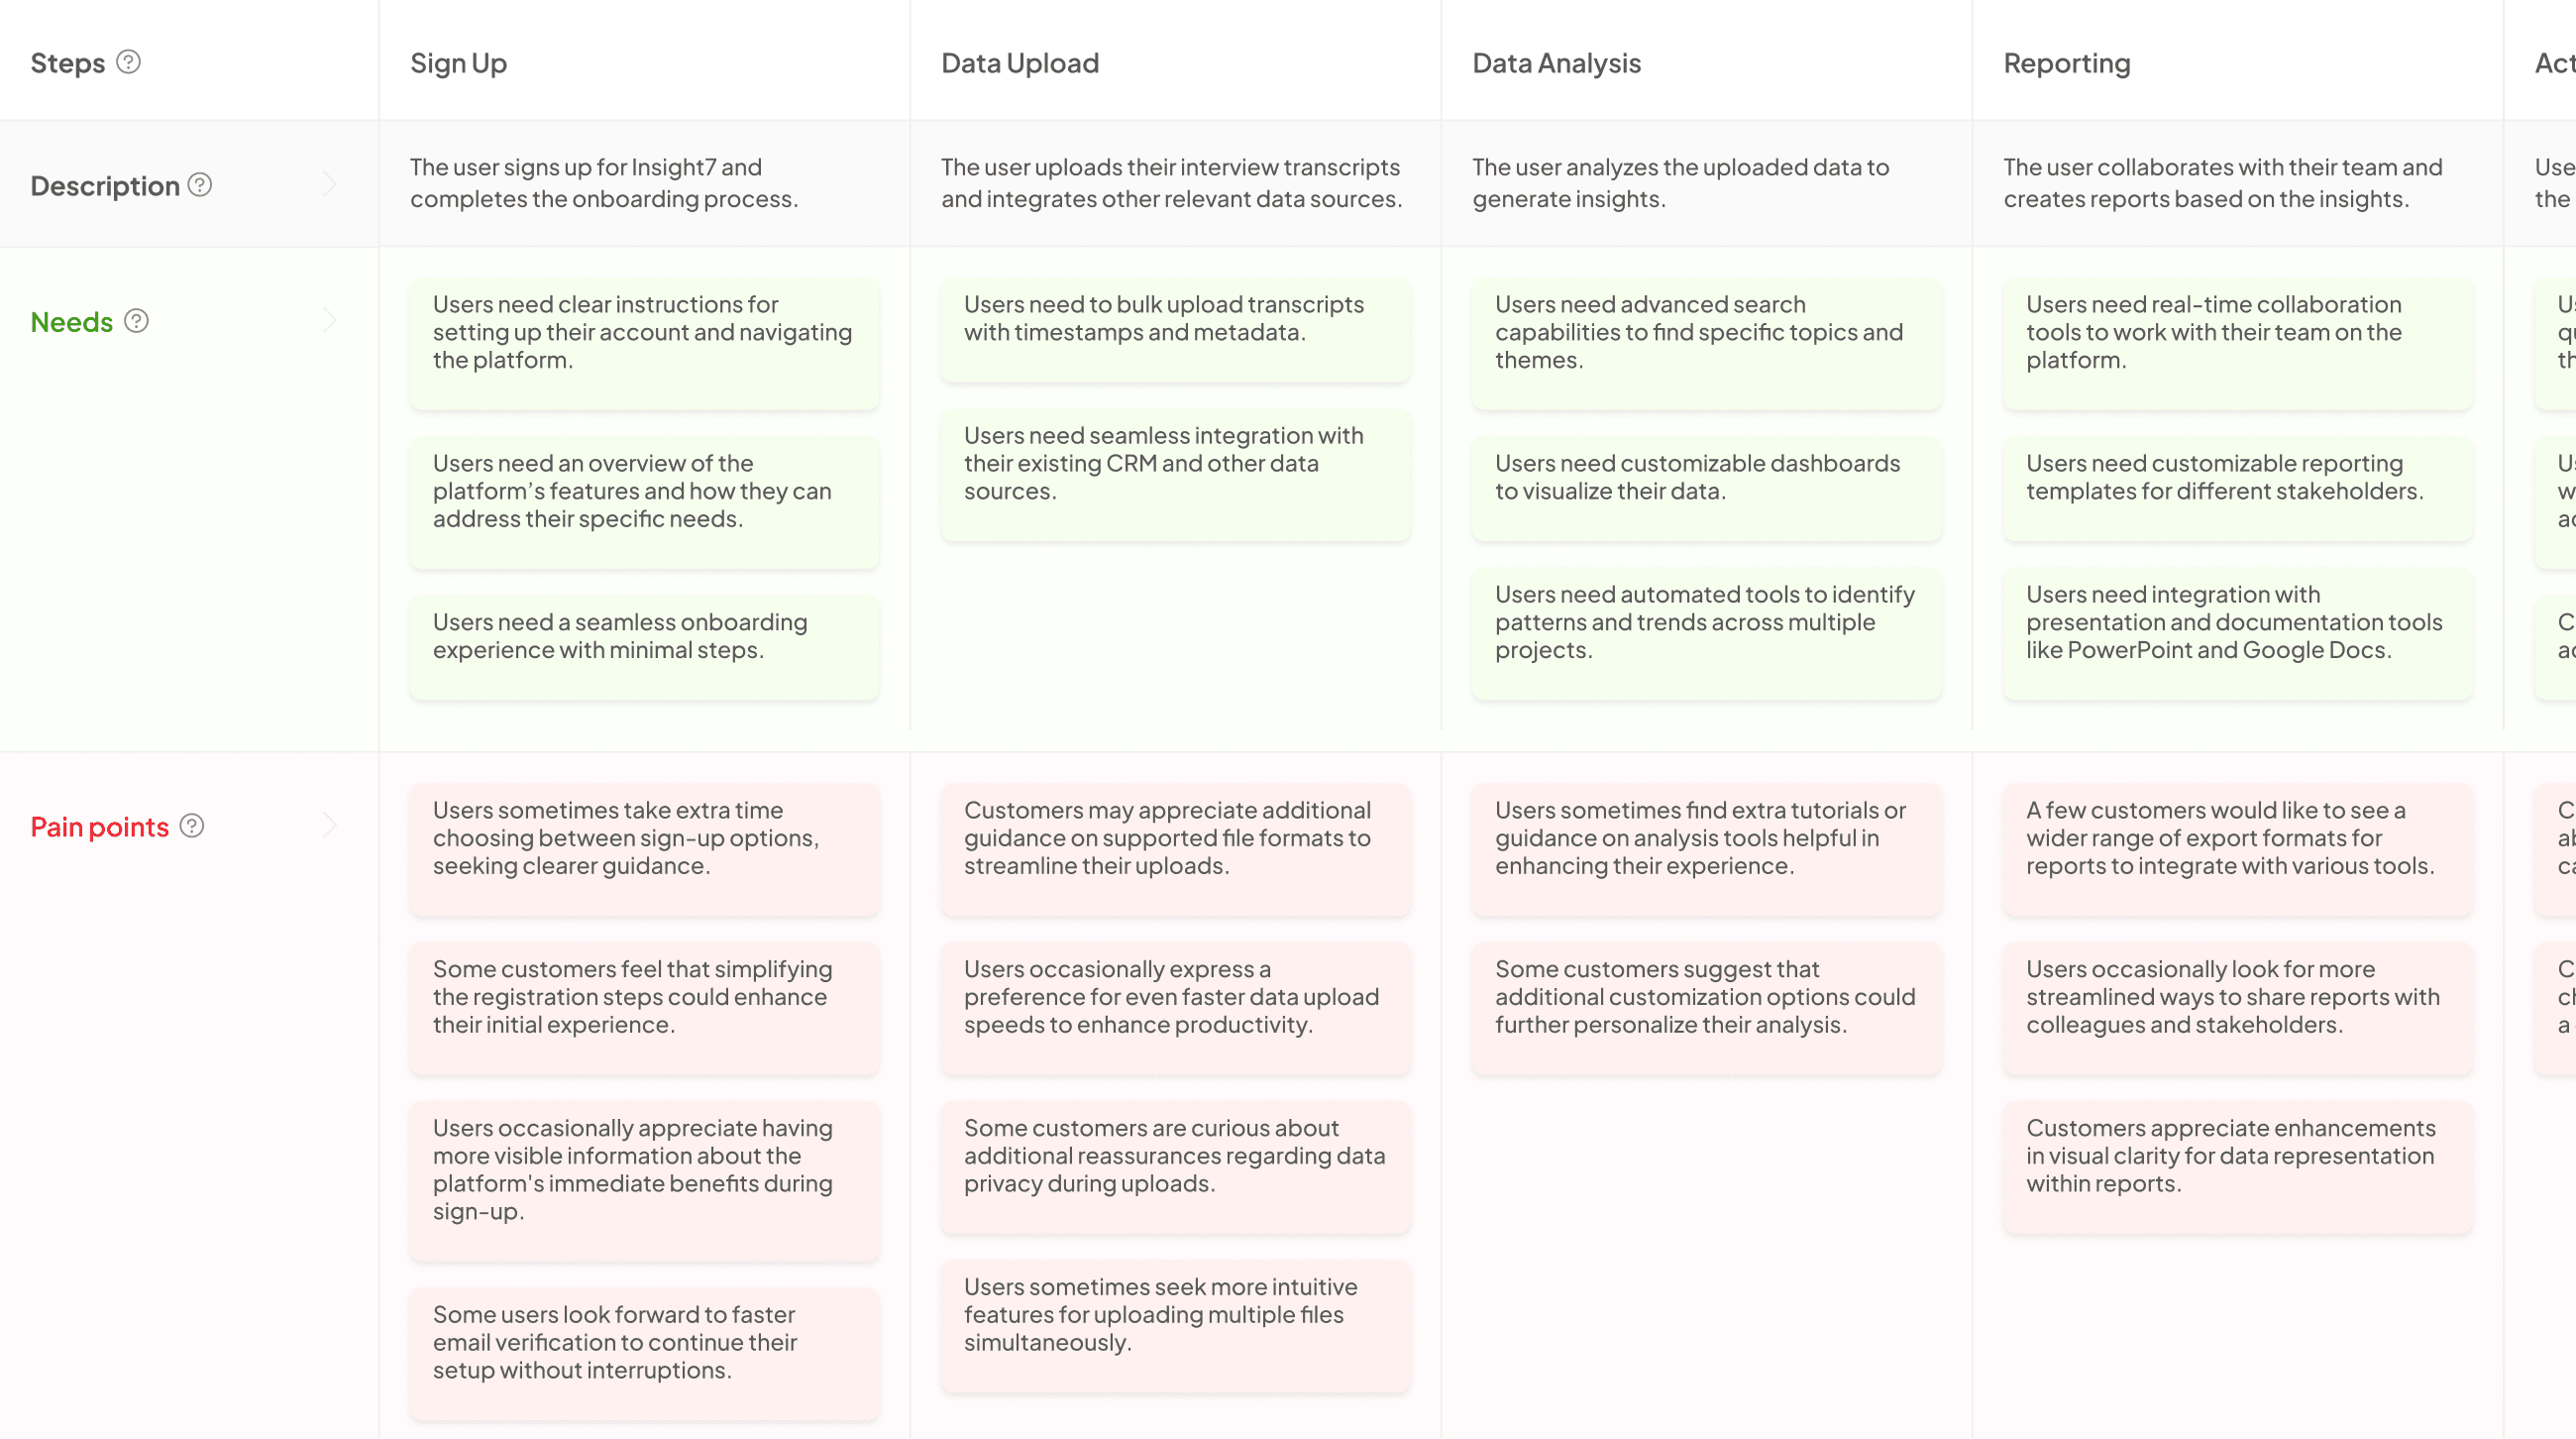
Defining Stakeholder Journey Maps
Stakeholder Journey Visualization serves as a vital tool in understanding the various experiences stakeholders encounter. A stakeholder journey map is essentially a visual representation that outlines these experiences step-by-step. Through this mapping, organizations can identify crucial touchpoints, highlighting where stakeholders feel satisfied, frustrated, or confused.
To create an effective stakeholder journey map, it’s essential to synthesize insights gathered from interviews. Begin by documenting key moments in the stakeholder experience and categorizing them based on emotions, actions, and pain points. This organized approach allows stakeholders and decision-makers to visualize the entire journey, thus revealing opportunities for improvement. By utilizing stakeholder journey visualization, an organization can transform complex data into actionable insights, enhancing overall stakeholder engagement and satisfaction. Ultimately, understanding and effectively visualizing these journeys is crucial to refining strategies and creating better experiences.
The Impact of Effective Visualization on Insights
Effective visualization significantly influences the insights derived from stakeholder journey mapping. When stakeholders’ experiences are represented graphically, it transforms complex data into clear, actionable knowledge. This clarity allows teams to identify patterns, recognize pain points, and highlight successes directly associated with user interactions. An engaging, visual representation enables stakeholders to not only see the data but connect with it emotionally, fostering a deeper understanding of the journey.
Moreover, stakeholder journey visualization supports collaborative discussions. By presenting insights visually, different teams can openly share perspectives, leading to collective problem solving and innovation. The ability to compare various stakeholder journeys in one visual map encourages a holistic view. This ultimately informs better decision-making, enhancing the overall stakeholder experience and aligning services to meet their needs effectively. Clear visualizations thus serve as essential tools in driving strategic initiatives and ensuring that stakeholder experiences are at the forefront of organizational goals.
Steps to Create Stakeholder Journey Maps from Interviews
Creating effective Stakeholder Journey Maps from interviews involves a systematic approach that captures key insights. Begin by conducting thorough stakeholder interviews, ensuring you ask open-ended questions to gather detailed feedback. This qualitative data will highlight pain points and needs, forming the foundation for your map.
Next, extract key insights from these conversations. Analyze transcripts for recurring themes and prioritize them based on frequency and significance. Identify both challenges and opportunities that stakeholders face throughout their journey. Once you have categorized these insights, it’s time to design your Stakeholder Journey Map. Utilize visual tools that present data in an engaging format, showcasing the complete journey from awareness to advocacy. This visual representation should reflect stakeholders’ emotions, touchpoints, and interactions for greater clarity and understanding. Implementing these steps will enable a robust visual framework that enhances stakeholder engagement and drives actionable insights.
Step 1: Conducting Effective Stakeholder Interviews
Conducting effective stakeholder interviews is the foundation for creating accurate Stakeholder Journey Visualizations. Begin by preparing your list of questions, ensuring they are open-ended to encourage dialogue. Establish a comfortable environment where stakeholders feel at ease sharing their thoughts and experiences. This will significantly enhance the quality of information gathered, paving the way for more insightful journey maps.
Next, actively listen during interviews and take detailed notes. This attentiveness allows participants to express themselves fully, providing richer insights into their journeys. After the interview, it's crucial to synthesize the information collected, identifying common themes and unique perspectives that emerge. By following these steps diligently, stakeholders will feel valued and empowered, ultimately leading to more comprehensive journey visualizations that accurately reflect their experiences.
Step 2: Extracting Key Insights from Interviews
In this phase, extracting key insights from interviews involves sifting through large volumes of conversation data to uncover meaningful patterns. Begin by organizing the responses into thematic categories where similar comments and concerns are grouped together. This systematic approach allows you to gain clarity on prevalent pain points and needs expressed by stakeholders. Engaging with the data in this way can lead you to identify recurring themes that form the foundation of your stakeholder journey visualization.
Next, utilize analytic tools to quantify and summarize findings. For instance, employing a matrix can help highlight the percentage of stakeholders who mention specific issues, aiding in prioritizing the most critical concerns. By visualizing these insights, you can create a compelling narrative that portrays the stakeholder journey more effectively. This transformation of raw interviews into actionable insights is essential, as it equips decision-makers with the information they need to make informed improvements to stakeholder experiences.
Step 3: Designing a Stakeholder Journey Map
Designing a Stakeholder Journey Map involves methodically visualizing insights gathered from stakeholder interviews. The aim is to create a clear representation of how stakeholders experience interactions at each stage of their journey. Identifying touchpoints, pain points, and emotional responses is essential in this process. By mapping these elements, teams can better understand stakeholder needs and expectations.
To create an effective journey map, start by organizing the data collected during interviews. Identify critical phases in the stakeholder journey, such as discovery, engagement, and evaluation. Next, highlight specific touchpoints that stakeholders encountered, noting any emotional highs or lows throughout the experience. Lastly, synthesize these insights into a cohesive visual format. This helps stakeholders see their journey clearly while pinpointing areas for improvement, making Stakeholder Journey Visualization a powerful tool for enhancing overall experience and satisfaction.
Tools for Stakeholder Journey Visualization
Utilizing effective tools for Stakeholder Journey Visualization enhances the clarity of insights derived from stakeholder interviews. These tools allow teams to illustrate the journey a stakeholder experiences from initial contact to final decision-making. Visualization captures the touchpoints, emotions, and pain points, facilitating a better understanding of stakeholder needs.
To maximize the impact of your visualizations, consider using tools like Miro, which promotes collaborative mapping; Lucidchart, known for its intuitive interface; or Smaply, which specializes in customer journey mapping. UXPressia is another noteworthy platform that integrates stakeholder insights seamlessly into visual designs. Each tool offers distinct features that can be matched with specific project requirements, ultimately leading to actionable insights and improved stakeholder engagement. By adopting the right tools, you can create vivid representations of stakeholder journeys, bringing their experiences to life and guiding future strategies effectively.
Insight7 and Its Features
Stakeholder Journey Visualization plays a crucial role in enhancing the clarity and effectiveness of journey maps derived from interviews. Insight7 serves as a powerful tool for this purpose, offering a range of features that streamline the visualization process. Firstly, it provides intuitive templates tailored for diverse stakeholder scenarios, enabling users to craft journey maps easily. This feature allows the extraction of meaningful insights from stakeholder interactions, ensuring that essential experiences are highlighted.
Moreover, Insight7 integrates data analysis capabilities that help identify patterns and trends within the collected insights. This step is vital in crafting a cohesive narrative that resonates with stakeholders' experiences. The platform's collaborative environment fosters team engagement, allowing multiple users to contribute their perspectives and refine journey maps together. By leveraging these features, organizations can transform raw interview data into compelling visual stories, enhancing understanding and alignment among stakeholders.
Other Useful Tools
Visualizing stakeholder journeys requires the right set of tools to transform data into insights. While platforms like Miro and Lucidchart offer user-friendly interfaces for creating journey maps, exploring other software options can enhance your visualization process.
Smaply is a notable tool that excels in creating dynamic stakeholder journey maps. It allows you to integrate various perspectives and adaptations to specific contexts. UXPressia stands out for its collaborative features, which enable team members to contribute in real-time, fostering creativity and diverse viewpoints. Additionally, incorporating data visualization tools can enrich your analysis by highlighting trends and patterns efficiently, facilitating better decision-making.
By leveraging these tools, you can create more comprehensive stakeholder journey visualizations. This, in turn, empowers stakeholders to understand and address pain points effectively, ultimately leading to the successful implementation of insights gathered from interviews. Choose the tools that best fit your needs to ensure a smooth journey mapping process.
Miro
Miro serves as a powerful tool for Stakeholder Journey Visualization, offering an interactive platform for collaboration. Its user-friendly interface allows teams to visually represent insights gathered from stakeholder interviews. With features like sticky notes, templates, and drawing tools, Miro adapts to different visualization needs. This flexibility fosters better engagement, ultimately leading to more effective discussions about the collected information.
To get started, create a board specifically for journey mapping. Next, outline the steps participants undertake, from initial touchpoints to final outcomes. Use colors and icons to differentiate stages, feelings, and pain points for a clearer understanding. By equipping stakeholders with a dynamic visual representation, Miro empowers teams to investigate experiences deeply and collaboratively craft solutions based on real feedback. This approach not only enhances the retention of insights but also builds a shared understanding among all involved parties.
Lucidchart
Lucidchart serves as a powerful tool for visualizing stakeholder journeys, allowing teams to transform insights from interviews into clear, actionable maps. By providing an intuitive interface, it simplifies complex data, enabling anyone within the organization to create visual representations without requiring advanced technical skills. Users can easily drag and drop elements to build journey maps that reflect the unique experiences of stakeholders, helping to identify pain points and areas for improvement.
Incorporating various shapes, lines, and colors, Lucidchart fosters creativity and clarity. This visualization not only helps teams communicate findings effectively but also aids in brainstorming sessions when discussing stakeholder behaviors and experiences. By centralizing feedback and observations, teams can collaboratively refine their stakeholder journey maps, enhancing the understanding of customer needs. Ultimately, Lucidchart enhances stakeholder journey visualization, making insights more accessible and actionable for decision-making.
Smaply
Smaply serves as an invaluable tool in the realm of Stakeholder Journey Visualization. This platform streamlines the process of transforming qualitative data from stakeholder interviews into visual representations that are easy to understand. By providing features like customizable journey mapping templates, users can effectively illustrate each step of the stakeholder experience. The visual tools offered help teams identify pain points and opportunities within the journey, facilitating better discussions on user needs and expectations.
Integrating Smaply into your workflow enhances collaboration by allowing multiple stakeholders to contribute simultaneously. This fosters a deeper understanding of the journey from various perspectives, which enriches the visual output. Additionally, the platform supports data connectivity and presentation options that ensure insights are not only gathered but also communicated effectively. Thus, using Smaply empowers teams to create compelling stakeholder journey maps that drive strategic decisions and enhance user experience.
UXPressia
Visualizing the stakeholder journey requires a tool that simplifies and enhances the mapping process. By facilitating the visualization of insights gathered from stakeholder interviews, a certain platform empowers users to create impactful journey maps. Anyone in the organization can access it, eliminating the need for complex training or expertise. This ease of use encourages collaboration and allows teams to unite around a shared understanding of customer experiences.
Key features of this tool include automated insight extraction from conversations and analysis of pain points and desires. Users can view transcripts, highlight significant quotes, and visualize data through user-friendly interfaces. This functionality turns raw data into actionable insights quickly. Moreover, working with a project setup allows for the aggregation of various calls, resulting in a comprehensive view of the stakeholder journey, leading to better decision-making and strategic planning.
Conclusion: Bringing Stakeholder Journey Visualization to Life
In conclusion, bringing stakeholder journey visualization to life requires a holistic approach that captures the essence of user experiences and insights. By effectively translating interview data into journey maps, organizations can illuminate the paths stakeholders take and identify key touchpoints and pain points along the way. This not only enhances understanding but also drives actionable recommendations that can improve stakeholder engagement and satisfaction.
To make stakeholder journey visualization impactful, it’s essential to embrace a user-centric mindset. This involves collaborating with stakeholders throughout the visualization process, ensuring their unique experiences inform the journey maps. Ultimately, this collaborative approach fosters a more comprehensive understanding, enabling organizations to create meaningful change based on clear, visual insights drawn from real stakeholder interactions.


