


How do your customers really feel when they talk to your team?
It’s easy to think things are going well, until customers start churning, or reviews start mentioning things you never saw coming. That’s why understanding how customers perceive your brand, especially on support calls, isn’t optional anymore. You need to see it clearly, at a glance. No guesswork or spending hours going through transcripts.
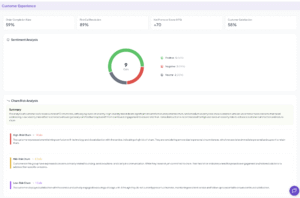
Let’s say you launch a new product feature, and your team’s excited. You’re getting more calls than usual, and a few customers seem frustrated, but it’s hard to pinpoint why. We built the customer experience dashboard to solve this. It’s your real time window into how your product is landing with customers.
You’ll see:
- Sentiment breakdowns for your calls (positive, negative and neutral)
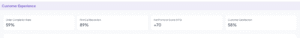
- Key customer experience KPIs like order completion rate, first call resolution, customer satisfaction, and Net Promoter Score
- Churn risk detection, based on the severity and context of what customers say
- The ability to upload context that will be used to improve the quality of your evaluation.
See Call Sentiment In One View
Each call is analyzed for customer sentiment, so you don’t have to manually go through recordings.
With one glance, you’ll know how the customer felt :
- Positive: Satisfaction, problem solved
- Negative: Frustration, unresolved issues
- Neutral: No strong emotion
This helps you identify patterns across teams, products, or time periods, fast.
Stay on top of the KPIs that actually matter
Beyond sentiment, the dashboard tracks your core customer experience KPIs, including:
- Order Completion Rate – Are calls leading to conversions or actions?
- First Call Resolution – Are issues being solved on the first try?
- Customer Satisfaction – How happy are people at the end of the call?
- Net Promoter Score (NPS) – Would they recommend your brand?
No need to build reports manually. It’s all right there.
Know Which Calls Pose A Churn Risk Before Its Too Late
The churn risk overview helps you surface potential risk signals before it’s too late. You can prioritize your follow up with the high risk, low risk and medium risk sections of the dashboard. This allows you protect your revenue proactively.
Frequently Asked Questions
How does the Customer Experience Dashboard determine call sentiment?
The dashboard uses AI powered speech and text analysis to classify each call’s sentiment as positive, negative, or neutral based on customer language, tone, and context.
Can I track specific customer experience KPIs all in one place?
Yes, it automatically tracks key KPIs including Order Completion Rate, First Call Resolution, Customer Satisfaction, and Net Promoter Score (NPS) without needing manual input.
How does the churn risk detection work?
The system analyzes conversation patterns and sentiment to identify calls that indicate potential customer dissatisfaction or churn risk, helping you prioritize timely interventions.
Is the dashboard suitable for non technical users?
Yes, it’s designed to be intuitive and easy to use, providing clear visualizations and actionable insights without requiring technical expertise.
Conclusion
The businesses leading today are the ones who listen and act fast.
The Customer Experience Dashboard gives you the visibility to do that, through clear, actionable insights from every call.
If you’re ready to move from guessing to clarity, start evaluating your calls with Insight7.


