


Every data enthusiast starts somewhere, often feeling curious and overwhelmed. This Beginners Data Guide sets the foundation for diving into data analysis, offering clarity and direction for newcomers in 2025. It addresses the fundamental concepts essential for understanding data and its application, ensuring you can confidently navigate this complex field.
This guide will introduce you to various tools, techniques, and step-by-step processes essential for effective data analysis. Whether you’re looking to interpret data sets or understand market trends, this resource is designed to empower you.
As you embark on your journey through the data realm, let this guide serve as your trusted companion, illuminating the path to data mastery. By the end of this guide, you’ll have a solid understanding of data analysis concepts and the confidence to apply them in real-world scenarios.
What is Data Analysis? An Essential Introduction for Beginners
Data analysis is the process of examining, cleaning, and interpreting data to uncover useful insights. It serves as a crucial tool in decision-making for businesses and individuals alike. Understanding the basics of data analysis can seem overwhelming for beginners, yet it provides essential navigation skills in today’s data-driven world.
As you embark on your journey, familiarizing yourself with core concepts will empower you to make informed choices.
Following this beginner’s data guide, you will discover how data can reveal patterns, trends, and correlations that may not be immediately obvious. This foundational knowledge paves the way for using tools and techniques, turning raw data into meaningful information.
Embracing data analysis will enhance your ability to draw actionable insights, thus enriching your understanding of various subjects and improving your overall decision-making capabilities.
Understanding the Importance of Data Analysis
The world is generating data at an exponential rate, thanks to digital transformation, connected devices, AI systems, and social platforms. In 2025, professionals and businesses are expected to leverage this data not just to track performance, but to drive innovation, improve customer experiences, and make evidence-based decisions.
Several trends highlight why data analysis is more important than ever:
AI and Automation: While tools can automate data collection and processing, human analysts are still essential for interpreting data and applying it to real-world challenges.
Data-Driven Cultures: Organizations that use data effectively tend to outperform those that rely on intuition or guesswork. From startups to global enterprises, data literacy is now considered a strategic advantage.
Cross-Industry Relevance: Every sector including healthcare, retail, logistics, finance, and education uses data to optimize outcomes, identify opportunities, and manage risks.
In essence, learning data analysis opens doors in nearly every career path and makes you more valuable in today’s economy.
Key Concepts and Terminologies in Data Analysis
Understanding key concepts and terminologies in data analysis is essential for anyone venturing into this field. Knowledge of terms such as “dataset,” “variable,” and “statistical significance” helps beginners navigate the complexities of data insights.
A dataset is essentially a collection of related data points, while variables represent attributes or characteristics that are measured. Knowing these basic elements can profoundly improve one’s ability to interpret and handle data effectively.
Another crucial term is “data cleaning,” which refers to the process of correcting or removing inaccuracies in the dataset. This step is vital, as accurate data is the foundation of meaningful analysis.
Additionally, concepts like “exploratory data analysis” (EDA) allow beginners to uncover patterns and identify trends within their data. By understanding these foundational terms, learners can effectively engage with the broader aspects of data analysis and make informed decisions based on their findings in this growing field.
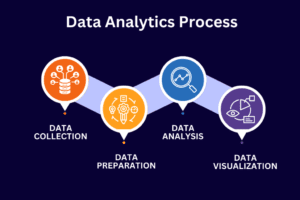
Step-by-Step Guide to Start Data Analysis
Here is a clear, repeatable process you can follow for almost any data project.
Step 1: Define Your Objective
Begin by clearly stating what you want to find out. A well-defined question gives direction to your analysis. For example, if you work in marketing, your objective might be to find out which advertising platform generates the highest return on investment.
Step 2: Collect Relevant Data
Once the objective is clear, gather data from appropriate sources. This could include:
- Google Analytics for website data
- CRM platforms like HubSpot or Salesforce for customer data
- Surveys for user feedback
- Public datasets from sources like Kaggle, UCI Machine Learning Repository, or Data.gov
Ensure that the data you collect is relevant, timely, and complete enough to support meaningful analysis.
Step 3: Clean and Prepare the Data
Raw data often contains inconsistencies, missing values, and errors. Data cleaning involves checking for duplicates, correcting formatting issues (such as inconsistent date formats or units), filling in missing values, and removing irrelevant information. Clean data sets the foundation for accurate analysis.
Step 4: Analyze the Data
With clean data, you can begin analyzing it to discover patterns, trends, and outliers. This may involve calculating averages, comparing performance over time, segmenting data by category, or identifying anomalies. The analysis should align with your objective and seek to answer your original question.
Step 5: Visualize and Communicate Findings
Present your findings using charts, graphs, or dashboards. Visualization tools help stakeholders quickly understand complex insights. Tools like Excel, Power BI, Tableau, and Google Sheets make it easier to create compelling visuals that tell a story.
Step 6: Interpret and Take Action
The final step is to make sense of the results. What do the trends mean? Are there clear takeaways or recommended actions? At this stage, you convert your findings into decisions or strategies that align with your goals.
1. Insight7 – Best for Qualitative Data Analysis
Insight7 stands out as a premier solution for analyzing unstructured and qualitative data, such as customer interviews, call recordings, open-ended survey responses, and voice-of-customer feedback.
Built for teams in marketing, research, sales enablement, and customer success, Insight7 automatically surfaces themes, patterns, and actionable insights—eliminating the manual labor of reviewing hours of transcripts or text responses.
Automated Insights: Using AI and NLP, Insight7 identifies patterns, sentiments, and recurring pain points across multiple conversations or feedback logs. This turns scattered qualitative data into structured, decision-ready insight.
Bulk Transcription Capability: Insight7 allows users to upload and transcribe multiple audio or video files at once, making it ideal for teams analyzing dozens or even hundreds of customer calls, interviews, or discovery sessions.
For professionals working with messy, conversational data or those who need to scale voice-of-customer analysis—Insight7 is an essential tool.
2. Excel and Google Sheets
Still foundational for anyone starting in data analysis, these tools are powerful for working with structured data. They support calculations, sorting, filtering, and basic visualization. For quick analysis or tabular reporting, they’re unmatched in simplicity and availability.
3. Tableau and Power BI
These platforms are ideal for users who want to build dynamic dashboards and interactive data visualizations. With drag-and-drop interfaces, they help you identify trends and communicate insights to stakeholders in a visually compelling way. Tableau tends to be more flexible for storytelling, while Power BI integrates seamlessly with Microsoft’s ecosystem.
Beginner-Friendly Data Analysis Examples
Practical examples make learning easier. Here are some simple projects to help you apply what you’ve learned:
Survey Analysis: Collect survey responses using a tool like Google Forms, export the data, and analyze customer satisfaction trends or pain points.
Website Traffic: Use Google Analytics to see which pages are most visited, how long users stay, and where traffic comes from.
Sales Data: Import historical sales data and calculate monthly averages, identify high-performing products, or assess seasonality.
Social Media Performance: Export post engagement data from platforms like Instagram or Twitter and analyze which content types perform best.
Customer Feedback: Use sentiment analysis (either manually or through AI tools) to classify customer reviews as positive, negative, or neutral.
Each of these examples helps build core analysis skills in a real-world context.
Common Mistakes to Avoid When Starting Out
Beginners often make errors that can distort insights or lead to incorrect decisions. Here are common pitfalls to watch for:
Neglecting Data Cleaning: Skipping this step can lead to incorrect analysis. Inconsistent or inaccurate data will produce unreliable results.
Assuming Correlation Equals Causation: Just because two things happen together doesn’t mean one caused the other. Always consider external factors and test your assumptions.
Overcomplicating Early Projects: Starting with overly complex models or datasets can be overwhelming. Focus on simple, clear projects first.
Ignoring Context: Data never exists in a vacuum. Make sure to consider business, market, or cultural context before drawing conclusions.
Lack of Documentation: Always document your methods, sources, and assumptions. This helps ensure transparency and makes it easier to repeat or update your analysis.
Being aware of these issues from the start helps you develop best practices and analytical integrity.
7 Expert Best Practices for Data Analysis for Beginners (2025)
Learning data analysis in 2025 goes beyond just knowing how to use tools—it’s about thinking critically, communicating clearly, and working efficiently. These expert-backed best practices will help beginners start strong and build lasting skills in data analytics.
1. Always Start With a Clear Business Question
Before opening a spreadsheet or dashboard, define what you’re trying to solve. Are you trying to understand why churn increased? Which marketing channel performed best? Starting with a focused question keeps your analysis purposeful and prevents wasted time.
2. Prioritize Clean, Reliable Data
Dirty or inconsistent data leads to misleading insights. As a beginner, learn to always review your dataset for missing values, duplicates, or formatting inconsistencies. Clean data is the foundation of accurate, trustworthy analysis.
3. Visualize Simply and Communicate Clearly
Charts and graphs should simplify—not complicate—your findings. Avoid overloading your reports. Use clear labels, logical chart types (bar, line, scatter), and always tie visuals back to your central insight. Great data analysts also learn to tell a story with their data, not just present numbers.
4. Avoid Correlation-Causation Errors and Explain Your Assumptions
Just because two metrics move together doesn’t mean one causes the other. Be cautious with conclusions and always question what else might be influencing results. Additionally, document your assumptions, filters, or changes made to the data so others can follow your logic.
5. Stay Focused: Don’t Chase Perfection
Many beginners fall into “analysis paralysis”—digging endlessly for patterns without producing insights. Instead, focus on drawing clear, timely conclusions that drive decisions. Good analysis leads to action, not endless exploration.
6. Practice on Real-World Projects
The best way to learn data analysis is by doing. Start with small, manageable projects using real data: analyze your website traffic, review customer feedback, or assess sales trends. These projects build both skill and confidence over time.
7. Stay Curious and Keep Learning
The data landscape evolves rapidly. As a beginner, embrace continuous learning. Follow industry blogs, take short online courses, explore tools like Insight7, and stay active in data communities. Developing your skills consistently will help you grow from beginner to expert.
Conclusion: Your Journey Forward with the Beginners Data Guide
This beginner’s guide is just the beginning of your journey into data analysis. You now have a strong foundation, practical tools, and the confidence to explore real-world data challenges.With each step you take, remember that ongoing practice and engagement will deepen your expertise. Welcome each challenge with curiosity, and enjoy the journey!
Download the free guide now and start your data analysis journey with confidence.
👉 Click here to download the PDF


