To embed effective visuals into your journey map, it’s essential to understand the critical role of transcripts. Transcripts serve as a treasure trove of data, allowing you to dive deep into user experiences and sentiments. By carefully extracting insights from these dialogues, you can illuminate the journey that customers take with your product or service. This not only enriches your understanding but also helps in identifying crucial touchpoints that define their experiences.

Each insight gleaned from transcripts can be visualized onto your journey map, creating a compelling narrative of user interactions. Structured representations, such as timelines or flowcharts, can visually delineate positive and negative experiences. By actively integrating visual elements into the journey map, you elevate user understanding and ensure corrective actions effectively address pain points. Ultimately, journey map visualization propels informed decision-making and enhances overall user satisfaction.
Introduction: Journey Map Visualization from Transcripts
In the realm of customer experience, understanding users' emotions and actions is critical. Journey map visualization transforms raw data into clear narratives, illuminating user interactions and experiences as they engage with a product or service. Utilizing transcripts from customer interactions provides a wealth of insights that can be visualized effectively, revealing the journey from initial research to purchase decisions, and ultimately, to user satisfaction.
This document explores the process of journey map visualization through transcripts. By tapping into detailed narratives captured in transcripts, we can highlight critical user touchpoints and uncover pain points. This systematic approach allows teams to enhance their understanding of customer needs, leading to more informed decisions and improved service delivery. Through careful analysis and visualization techniques, we can create a comprehensive journey map that not only represents the user experience but also fosters meaningful improvements across the customer journey.
Understanding the Basics of Journey Map Visualization
Journey Map Visualization is a compelling method for understanding customer experiences by visually representing their journeys. It transforms raw data from transcripts into structured, understandable maps that highlight each customer's interaction with a service or product. By mapping these journeys, one can identify critical moments that shape user experiences, such as pain points and satisfaction levels.
At its core, Journey Map Visualization captures the essence of user interactions across various stages. This process typically involves pinpointing key touchpoints where customers engage with the service. Analyzing these interactions reveals vital insights, allowing businesses to target areas for improvement effectively. As you delve into this visualization, remember to focus on not only the tasks users perform but also on their emotions throughout the journey. This holistic view fosters a more empathetic understanding of user needs and enhances decision-making for better service delivery.
What is a Journey Map?
A journey map is a strategic tool that helps visualize the user experience across various stages of interaction with a product or service. Essentially, it outlines the complete path a user takes, from the moment they first engage to when they finalize their experience. This visualization captures key moments of engagement, highlighting user emotions, thoughts, and interactions to identify both opportunities and challenges they may face.
To create effective journey map visualizations from transcripts, it is crucial to focus on several components. First, the map should incorporate touchpoints, which are critical interactions between the user and the service. Second, documenting user pain points is essential, as these are areas that often signify disconnect or frustration. Finally, insights gathered from the transcripts can guide recommendations for improvement, ensuring a more refined user experience over time. Understanding these components allows for a better representation of the user's journey and aids organizations in tailoring their services to meet user needs effectively.
- Definition and Purpose
Journey Map Visualization refers to the process of creating a visual representation of a user's experience as they interact with a product or service. This visualization helps stakeholders understand the user journey in a structured and clear manner. It encompasses key touchpoints, emotions, and pain points, ultimately guiding organizations in improving user experiences.
The purpose of Journey Map Visualization is multi-faceted. Firstly, it assists in identifying critical moments that significantly impact user satisfaction or dissatisfaction. Secondly, it allows teams to recognize patterns and trends in user behavior, fostering informed decision-making. By visualizing insights from transcripts, organizations can create compelling narratives that closely represent the user journey, leading to more effective product enhancements. In summary, this technique not only clarifies user interactions but also serves as a strategic tool for improving overall service delivery.
- Key Components
Key components play a pivotal role in the effective visualization of journey maps from transcripts. Understanding these components begins with identifying touchpoints within the customer experience. These touchpoints represent critical interactions where customers engage with a product or service. Transcripts serve as valuable sources for pinpointing these moments, ensuring that the journey map reflects actual user experiences and sentiments accurately.
Furthermore, capturing the emotional responses of users at different stages is essential. Emotional insights gleaned from transcripts can dramatically influence the design of your journey map, bringing nuances that raw data alone may overlook. An additional component to consider is the identification of pain points revealed in the transcripts. These challenges signify areas for improvement, which should be addressed in the visualization process. Ultimately, integrating these key components—touchpoints, emotional responses, and pain points—ensures that the journey map visualization is both comprehensive and user-centric.
Importance of Transcripts in Journey Map Visualization
Transcripts play a pivotal role in journey map visualization by translating verbal interactions into structured insights. They serve as a rich source of user feedback, capturing authentic emotions, pain points, and motivations directly from the users' voices. This firsthand information enhances the accuracy of journey maps, allowing organizations to identify key touchpoints and areas needing improvement.
Utilizing transcripts in this context comes with numerous advantages. For one, they can help uncover patterns that may be missed during superficial analysis. By drawing out the main themes and sentiments from conversations, snippets from transcripts can highlight critical trends. This approach ensures that journey maps reflect the genuine customer journey, resulting in actionable insights that facilitate effective decision-making. By translating raw feedback into visual data, organizations can ultimately reinterpret the user experience more effectively, leading to enhanced strategies and solutions.
- Role of Transcripts in Capturing User Insights
Transcripts play a vital role in capturing user insights, providing a detailed account of customer interactions. These textual records allow teams to analyze conversations and identify patterns that might go unnoticed in raw audio formats. By transcribing customer calls, teams can effectively uncover valuable insights about user experiences, preferences, and pain points, ensuring that every voice is heard in the journey map visualization process.
Utilizing transcripts not only aids in extracting quantitative data but also supports a qualitative understanding of the user’s journey. Insights derived from transcripts serve as the foundation for identifying key touchpoints within the journey map. They help pinpoint areas for improvement and ensure that essential details, such as user emotions and frustrations, are accurately represented. Ultimately, clear and concise transcripts facilitate the creation of comprehensive and effective journey maps, leading to informed decision-making and enhanced user experiences.
- Advantages of Using Transcripts for Accurate Journey Maps
Using transcripts for accurate journey maps offers significant advantages in understanding customer experiences. Firstly, transcripts provide a detailed account of user interactions, capturing distinct emotions and pain points throughout their journey. This rich qualitative data allows for a nuanced visualization of customer experiences, pinpointing friction areas that may not be evident from quantitative data alone.
Additionally, transcript analysis fosters a more precise journey map visualization. By elucidating user motivations and actions, organizations can create comprehensive maps that reflect real experiences. This deep understanding not only identifies where improvements are necessary but also guides strategic recommendations to enhance user satisfaction. Utilizing transcripts ensures that journey maps are not mere representations but actionable tools that drive meaningful changes in the customer journey.
Step-by-Step Guide to Visualizing Journey Maps from Transcripts
Visualizing journey maps from transcripts is an essential process for understanding user experiences. The first step involves gathering and preparing transcripts; this ensures your data is high-quality and well-organized for analysis. Collect audio recordings, transcribe them for accuracy, and then format these transcripts for easy access. Effective preparation sets the foundation for insightful journey map visualization.
Once your transcripts are ready, the next focus is identifying key touchpoints and pain points. Carefully analyze the transcripts for user interactions, highlighting moments that stand out. Look for recurring themes or significant issues that may affect the overall user experience. Finally, integrate these insights to build a comprehensive journey map. Design a visually compelling representation that captures user emotions, interactions, and obstacles, ensuring this map serves as a valuable tool for understanding and improving customer journeys. By following these steps, you'll effectively visualize journey maps that drive actionable user-centered improvements.
Step 1: Gathering and Preparing Transcripts
Start by gathering and preparing transcripts to effectively fuel your journey map visualization efforts. This essential first step involves transcribing audio recordings into written text, which serves as the foundation for meaningful insights. High-quality transcripts capture the nuances of conversations, making it easier to identify user sentiments, behaviors, and experiences. Utilizing bulk transcription tools can streamline this process, allowing you to handle multiple files efficiently.
Once you have your transcripts ready, the next task is organizing them for analysis. Create a library to store your transcripts, enabling easy access and management. Segment the data according to key themes or customer segments to facilitate focused analysis. By carefully arranging your transcripts, you can more readily spot critical touchpoints and pain points, forming a solid base for visualizing the user journey effectively. The insights gleaned here will significantly enhance the clarity and impact of your final journey maps.
- Collecting High-Quality Data
Collecting high-quality data is a crucial step for effective journey map visualization. To begin, focus on gathering transcripts from customer interactions, ensuring they are clear and comprehensive. Quality matters; therefore, audio clarity and the relevance of content should be prioritized. When transcripts accurately reflect customer conversations, it becomes easier to pinpoint essential touchpoints in the user journey.
Once the transcripts are collected, the next step is organizing them systematically. Categorizing the data allows for seamless analysis, enabling teams to identify recurring patterns and insights. Leveraging this structured data can lead to the discovery of pain points and opportunities for improvement. High-quality data not only facilitates better visualization but also enhances the understanding of customer experiences, supporting more informed decision-making in the future. Ultimately, the goal is to create a journey map that is both insightful and actionable, grounded in precise customer narratives.
- Organizing Transcripts for Analysis
Organizing transcripts is a crucial step in the journey map visualization process. This phase transforms raw conversation data into structured insights that inform a clear visual narrative. When organizing your transcripts, it's essential to create a systematic approach that allows for easy navigation and analysis. Begin by categorizing transcripts based on themes or topics. This categorization can help in identifying relevant user experiences and common pain points across different interactions.
Next, consider annotating the transcripts with keywords and highlights. This practice not only streamlines the analysis but also enhances the ability to pinpoint significant insights quickly. By tagging relevant sections, you set the foundation for a comprehensive journey map that accurately reflects the user experience. Properly organized transcripts become a powerful resource, guiding you through the nuances of user interactions. Ultimately, a well-structured organization of transcripts is vital for effective journey map visualization, enabling a deeper understanding of user needs and experiences.
Step 2: Identifying Key Touchpoints and Pain Points
To effectively visualize journey maps, the next step is to pinpoint key touchpoints and pain points experienced by users. This phase involves delving into the transcripts to uncover crucial moments during the user journey, where customers interact with the product or service. Begin by categorizing these interactions in sequential order, allowing you to see where users are satisfied and where they encounter obstacles.
Next, focus on identifying pain points—these are critical areas for improvement. Each time a user expresses dissatisfaction or confusion in the transcripts, it reveals an opportunity for enhancement. By summarizing these findings, you can create visual representations that highlight these touchpoints and pain points effectively. This analysis serves as a foundation for crafting a comprehensive journey map, allowing stakeholders to prioritize solutions and strategies that foster better customer experiences.
- Analyzing Transcripts for User Interaction
Analyzing transcripts is a critical step in refining user interaction within journey map visualization. By thoroughly examining these transcripts, we can uncover essential insights that illuminate the user's experience. The initial phase involves transcribing audio conversations into text format, making it easier to identify trends and patterns in user feedback. This process allows us to capture the nuances of user sentiment, highlighting both positive and negative touchpoints experienced during their journey.
Next, focus on pinpointing significant pain points and moments of delight shared by users in their dialogues. Systematic analysis of these interactions enables us to visualize the journey map effectively, making it a dynamic tool for understanding user behavior. Detailed transcripts become a rich source for extracting direct quotes and contextual evidence, which can support the visualization process and enhance its reliability. Ultimately, this analysis not only aids in creating accurate journey maps but also fosters improvements in user experience based on direct customer feedback.
- Pinpointing Areas of Improvement
Identifying areas of improvement is crucial in the journey map visualization process. By deeply analyzing transcripts, you can glean valuable insights that highlight both strengths and weaknesses in user experiences. Start by pinpointing the specific touchpoints within the user journey where issues frequently arise. These areas often reveal patterns that indicate the need for enhancements.
Next, utilize visual tools to represent these findings. A clear visualization will highlight recurring themes, such as common pain points or desires expressed by users. For example, if a significant number of customers mention frustration during onboarding, this specific touchpoint becomes a priority for improvement. Regularly revisiting these visual representations ensures that you not only track progress but also adapt to evolving user needs and preferences. Ultimately, effective journey map visualization empowers you to create meaningful changes in user experience.
Step 3: Building a Comprehensive Journey Map
To effectively visualize user experiences, building a comprehensive journey map is crucial. Integrating findings from transcripts allows organizations to grasp the entirety of the customer experience. Begin by assessing the transcripts to identify key touchpoints where users interact with your service. Each interaction reveals valuable insights into user needs, pain points, and areas for improvement.
💬 Questions about How to visualize journey maps from transcripts?
Our team typically responds within minutes
Once you've gathered this information, create a visually compelling journey map. Highlight the customer’s path from the research phase through decision-making to product usage. Use clear visuals to represent emotions, challenges, and suggestions at each stage. This level of detail ensures that stakeholders not only understand the current user experience but can also strategize future enhancements. By investing time into this journey map visualization, businesses can foster better customer relationships and improve overall service delivery.
- Integrating Findings from Transcripts
Integrating findings from transcripts is essential for developing an effective journey map visualization. To begin, it is crucial to extract key insights directly from the data gathered through conversations. This process often involves transcribing audio recordings into text, enabling a deeper analysis of customer experiences. Once transcriptions are in hand, patterns related to user interactions can be identified, revealing vital touchpoints and pain points along the customer journey.
Next, synthesizing these insights into a coherent structure enables the creation of a detailed journey map. By focusing on different stages of the customer journey, one can visually represent the findings, illustrating both positive experiences and areas needing improvement. The combination of qualitative insights from transcripts and visual elements creates a compelling narrative that not only informs strategy but also enhances understanding of the customer experience. This holistic approach ultimately leads to more informed decision-making and improved user engagement.
- Designing a Visually Compelling Map
Designing a visually compelling map is crucial for illustrating insights derived from transcripts. A well-constructed journey map not only highlights user experiences but also serves as a powerful communication tool. Incorporating elements such as colors, icons, and thoughtful layouts can make the map more engaging and intuitive. By clearly delineating various stages of the user journey, you can showcase key interactions and emotional highs and lows that the user encounters.
To design an effective journey map visualization, consider the following key components. First, ensure that your map tells a coherent story by including clear titles and labels for each segment. Second, utilize visual hierarchy to emphasize the most important touchpoints, guiding your audience's attention appropriately. Third, add visuals like graphs and user quotes sourced from transcripts to lend credibility and depth to the journey being presented. By focusing on these elements, you create a visually appealing yet informative journey map that resonates with your audience.
Tools for Journey Map Visualization from Transcripts
To achieve effective journey map visualization from transcripts, it's essential to have the right tools at your disposal. Various applications can assist in processing, analyzing, and visualizing customer interactions by extracting actionable insights. Each tool offers unique features that simplify the journey mapping process.
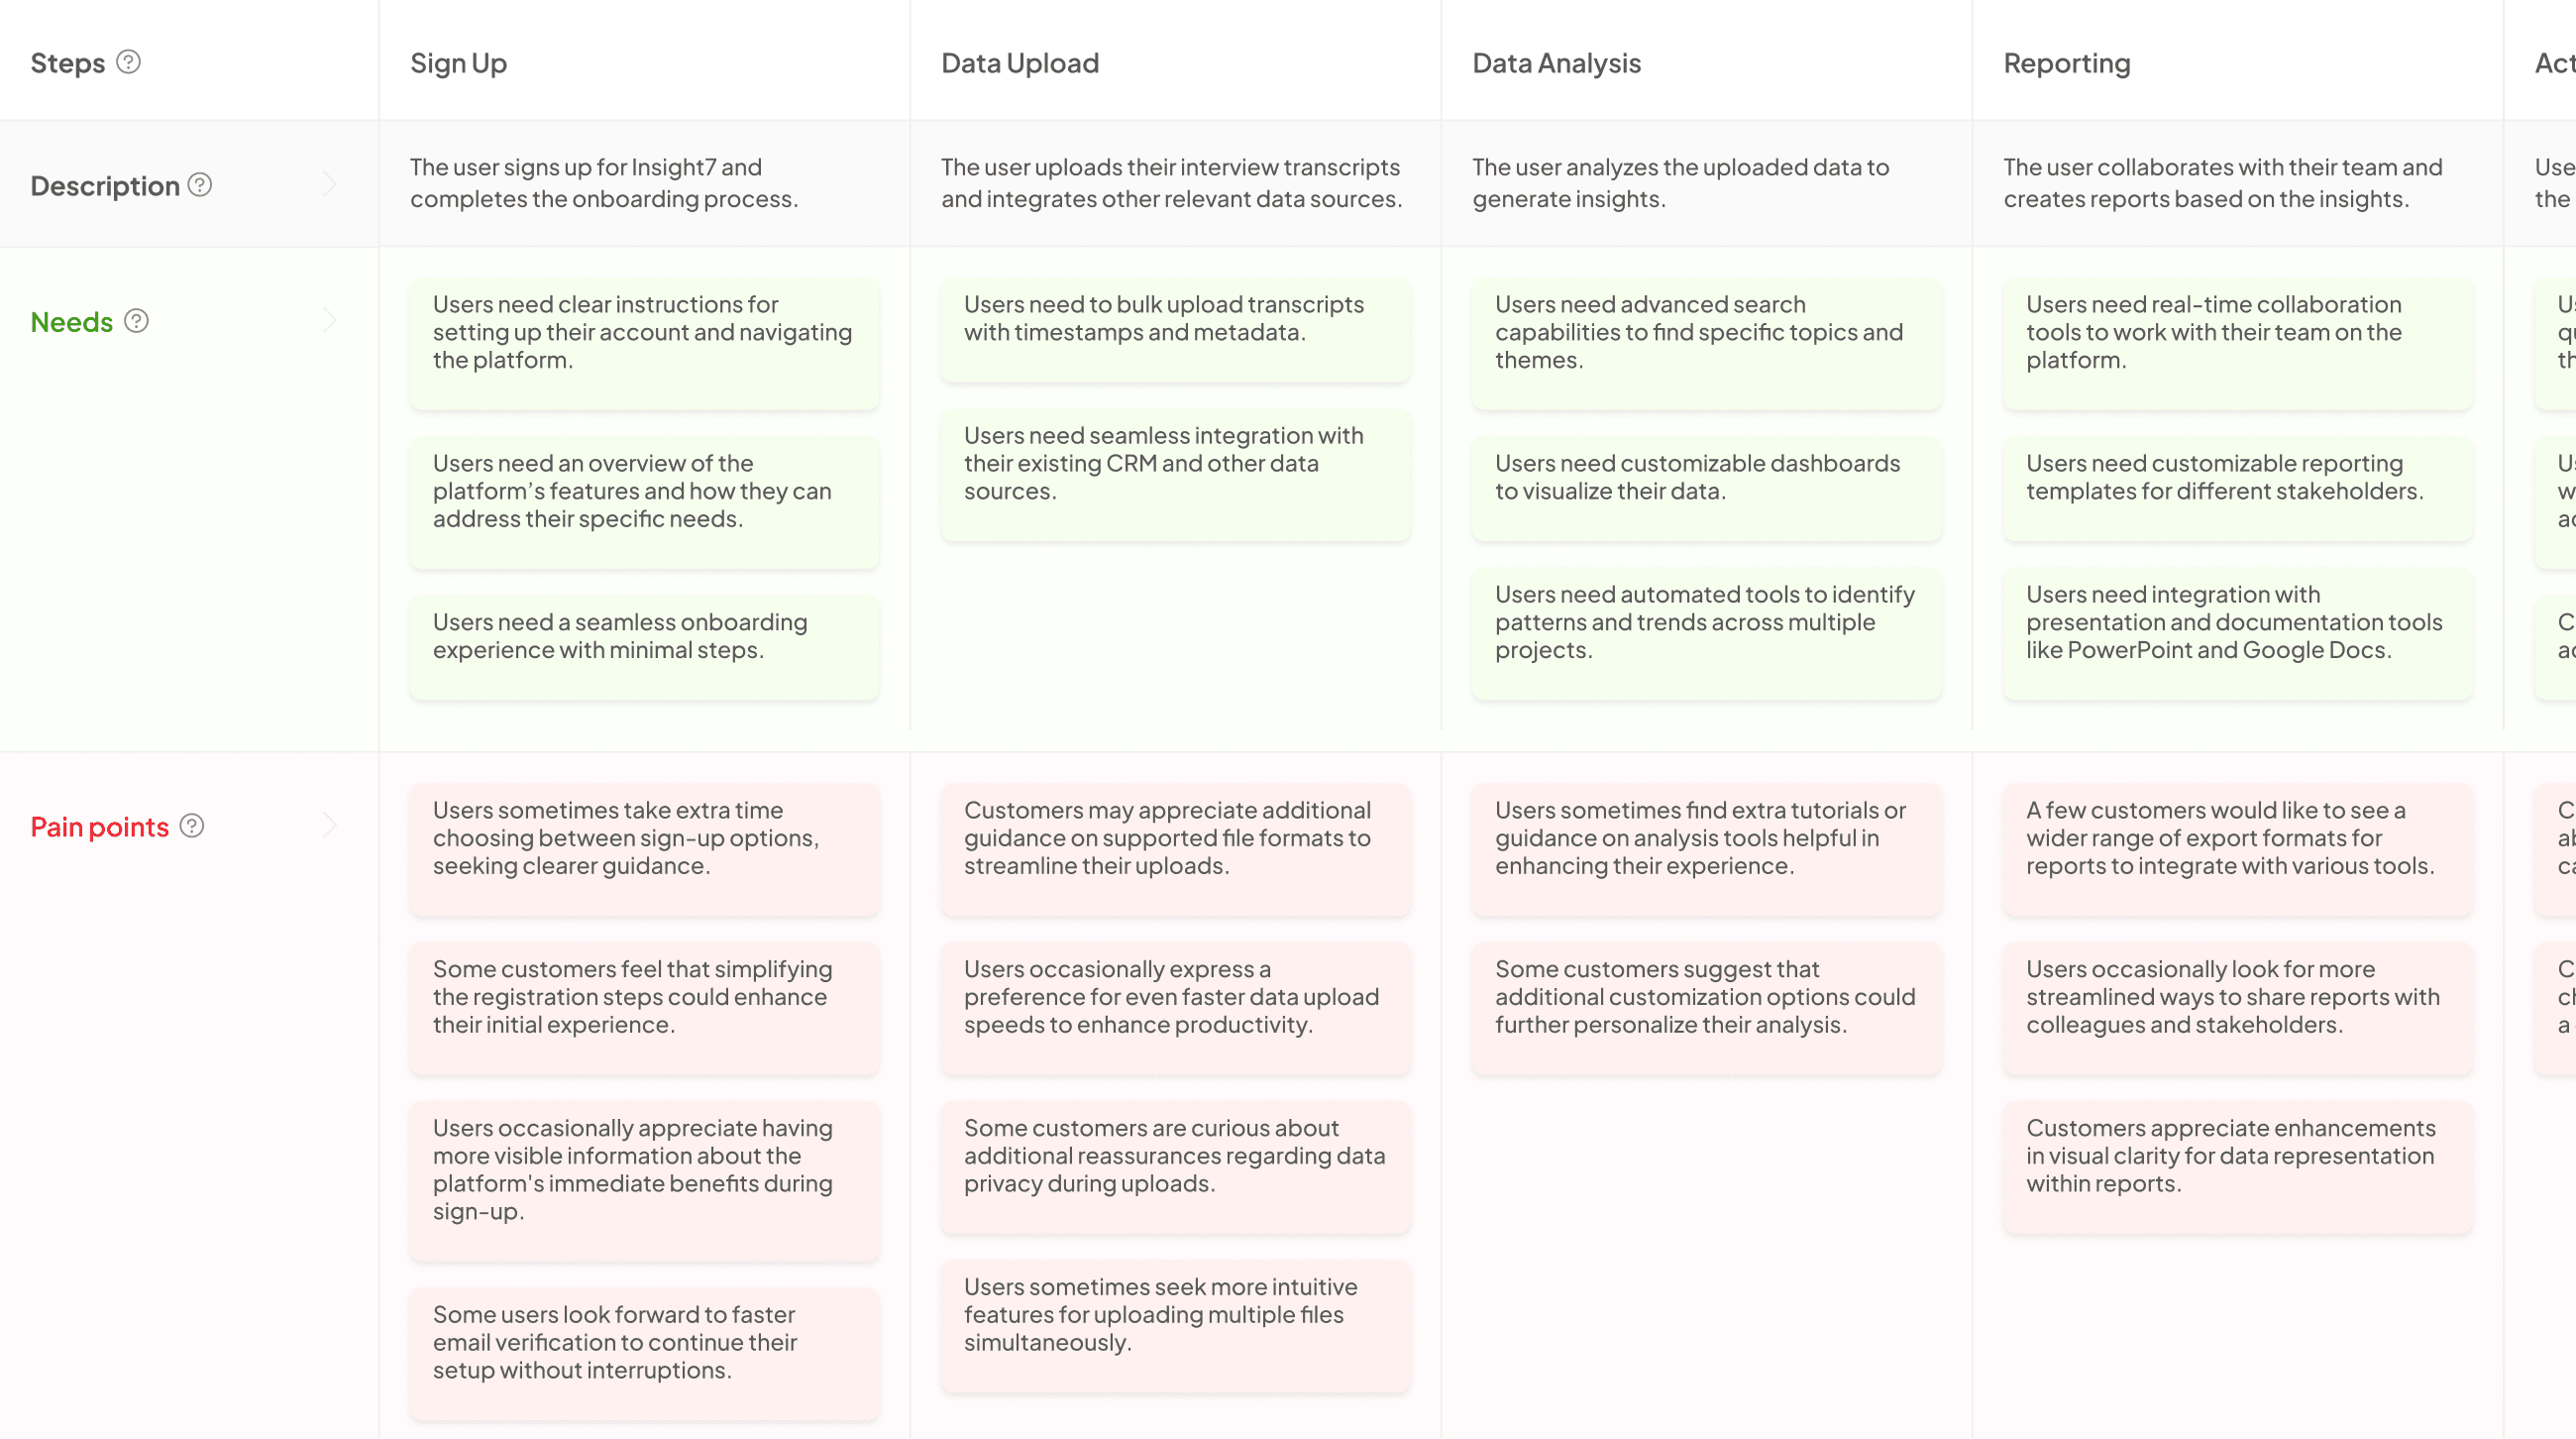
Insight7: This tool allows bulk transcription and analysis of audio files, making it easy to examine extensive customer conversations. It extracts valuable insights, pain points, and other significant data, all tailored to the needs of the user experience.
Miro: This collaborative tool facilitates team brainstorming sessions and provides templates for journey mapping. Teams can visually map out customer interactions in real-time, enhancing collaboration and understanding.
UXPressia: Known for its detailed journey mapping capabilities, UXPressia allows teams to visualize their customer journeys with various customizable options, making it easier to highlight critical insights.
Smaply: The strength of Smaply lies in its simplicity. It offers a user-friendly approach to journey mapping, helping teams visualize and communicate customer experiences effectively.
Lucidchart: As a versatile diagramming tool, Lucidchart is ideal for creating comprehensive flowcharts and diagrams that represent user journeys. Its intuitive interface makes it accessible for users of all skill levels.
Using these tools, organizations can ensure their journey map visualization accurately represents customer interactions and highlights critical areas for improvement.
Insight7
In Insight7, the focus shifts to the practical application of journey map visualization. By analyzing transcripts effectively, organizations can unearth critical insights about user experiences. This transformative approach allows teams to visualize the customer journey in a way that highlights pain points and key interactions. Understanding how customers engage during conversations leads to more informed strategies that enhance user experience.
The process involves several steps. First, effective gathering and preparation of transcripts are essential. This ensures high-quality data that serves as the backbone for analysis. Next, identifying key touchpoints calls for a meticulous examination of the transcripts, allowing for the pinpointing of areas needing improvement. Finally, building a comprehensive journey map integrates these findings into a visually compelling format. This visual representation not only communicates insights clearly but also fosters collaboration across teams. Ultimately, Insight7 empowers organizations to create impactful journey maps that drive positive change.
- Features and Benefits
Journey Map Visualization offers a range of features that empower users to effectively analyze customer experiences. By transforming conversation transcripts into visual formats, stakeholders can identify key touchpoints that influence customer satisfaction. This not only aids in understanding user journeys but also enhances overall engagement strategies.
One significant benefit of Journey Map Visualization is the ability to pinpoint pain points within customer interactions. By dissecting transcripts, teams can uncover areas that require improvement, leading to more informed decision-making. Furthermore, these visual representations facilitate better communication across departments, allowing for a shared understanding of the customer experience. Ultimately, utilizing journey maps derived from transcripts enables organizations to align their products and services with actual user needs, fostering a culture of continuous improvement.
- How Insight7 Enhances Journey Mapping
Insight7 significantly enhances journey mapping by transforming raw transcripts into clear visual representations of customer experiences. This process begins by extracting critical insights from user conversations, revealing their pain points and preferences along their journey. Clarity improves as transcripts are analyzed, highlighting key touchpoints and allowing for a more comprehensive understanding of user interactions.
One of the essential benefits of this type of journey map visualization is the ability to illustrate customer needs at each stage of their experience. By presenting this information in an organized visual format, stakeholders can easily identify friction areas and actionable recommendations. This visual tool not only aids in strategizing improvements but also ensures alignment among team members by providing a shared understanding of the customer journey. With Insight7, organizations can effectively blend qualitative data from transcripts into actionable insights. This approach ensures that decision-making is rooted in genuine user experiences, driving impactful changes and enhancing overall service delivery.
Other Tools to Consider
When considering journey map visualization, several additional tools can enhance your analysis beyond standard methods. Each tool offers unique features that cater to various aspects of visualization, collaboration, and user experience. For instance, Miro is an excellent choice for collaborative mapping, allowing teams to brainstorm and visualize customer journeys in real-time. This interactivity can significantly improve engagement and idea generation among team members.
Another useful tool is UXPressia, which specializes in creating detailed customer journeys. This platform emphasizes storytelling and provides templates to help visualize emotional highs and lows throughout the user's experience. Similarly, Smaply simplifies the journey creation process, making it user-friendly for teams of all sizes. Lastly, Lucidchart serves as a versatile diagramming tool, enabling detailed visualizations that can integrate seamlessly into existing workflows. By exploring these tools, teams can significantly enhance their approach to journey map visualization, tailored to their specific needs and objectives.
- Miro: Collaborative Mapping
Miro serves as an excellent tool for collaborative mapping, enhancing the visualization of journey maps derived from transcripts. By enabling real-time collaboration, teams can work together seamlessly to analyze user insights, identify patterns, and visualize complex data. This platform not only allows users to import transcripts but also encourages brainstorming sessions that convert textual data into visual components effectively.
In Miro, different elements such as sticky notes, shapes, and arrows create an engaging journey map. Users can categorize touchpoints and pain points alongside corresponding insights from transcripts, fostering clarity and organization. Moreover, the interactive features in Miro empower teams to edit and refine their mappings collaboratively, ensuring everyone is on the same page. This collaborative aspect enhances communication and drives more actionable insights, ultimately enriching journey map visualization and strengthening decision-making processes.
- UXPressia: Detailed Customer Journeys
To create detailed customer journeys, start by visualizing the experiences documented in transcripts. These narratives provide crucial insights into customers' interactions throughout their journey. By focusing on touchpoints, you can capture the various stages from initial research to decision-making. Not all experiences are positive, and addressing friction points is vital for improvement.
Next, compile the information gleaned from these transcripts into a clear visual format. This representation should highlight the emotional responses and needs of customers as they navigate their journey. It allows stakeholders to quickly identify areas needing enhancements while celebrating successes in customer interactions. The synergy between the raw data and its visual interpretation is essential for developing actionable strategies that improve overall customer experience. Through effective journey map visualization, organizations can align services with customer expectations, leading to better satisfaction and conversion rates.
- Smaply: Simplifying Journey Creation
Creating effective journey maps can often feel overwhelming, especially when sifting through extensive transcripts. However, there's a solution that simplifies this process by effectively transforming data into meaningful visuals. This tool stands out by allowing users to easily visualize the entire customer journey, from initial research to post-purchase evaluation. As a result, businesses can effortlessly pinpoint customer needs and identify pain points along the way.
Moreover, these journey map visualizations are not just about aesthetics; they encapsulate critical recommendations and insights derived from the data. By focusing on key touchpoints highlighted in the transcripts, organizations can refine their strategies, enhance user experiences, and ultimately drive better outcomes. The ability to visualize customer interactions effectively allows teams to make informed decisions, ultimately leading to increased satisfaction and engagement. With this simplified approach to journey creation, you can navigate the complexities of customer journeys more effectively.
- Lucidchart: Versatile Diagramming Tool
Using a versatile diagramming tool can greatly enhance the process of journey map visualization from transcripts. This tool allows users to create clear, organized representations of user experiences, capturing every essential detail along the way. Whether you are an individual or part of a larger team, its user-friendly interface enables everyone to contribute their insights effectively.
One of the standout features is its ability to transform complex transcript data into informative visuals. Users can easily identify key touchpoints and pain points, translating raw data into actionable insights. Furthermore, the collaborative nature of the tool fosters communication among team members, allowing for shared understanding and alignment on user experiences. By utilizing this platform, you can build comprehensive journey maps that not only highlight user interactions but also streamline the decision-making processes based on comprehensive analysis.
Conclusion: Bringing it All Together with Journey Map Visualization
In conclusion, journey map visualization serves as a powerful tool to synthesize user experiences from transcripts into informative visual formats. By transforming qualitative data into clear visuals, teams can grasp the essence of user journeys, revealing friction points and opportunities for enhancement. Each step of the journey, from initial research to final decision-making, can be outlined, providing a comprehensive view of customer interactions.
Through effective journey map visualization, businesses can identify not just user needs, but also critical pain points. This approach empowers organizations to take actionable steps, ensuring that user insights are not just noted, but fully integrated into the design process. Ultimately, embracing journey map visualization enriches decision-making and fosters a deeper understanding of customer experiences.
## Tools for Journey Map Visualization from Transcripts

Journey Map Visualization relies heavily on various tools that can streamline the process, enhancing the accuracy and effectiveness of the created maps. Firstly, Insight7 stands out due to its unique features that allow users to effortlessly capture insights from transcripts. This tool not only simplifies data analysis but also provides visual outputs that are easy to understand.

In addition to Insight7, other tools offer valuable functionalities. Miro promotes collaborative mapping, enabling teams to contribute in real-time. UXPressia allows for detailed customer journey creation, helping users visualize their findings effectively. Smaply makes journey mapping easier with its user-friendly interface, while Lucidchart is a versatile diagramming tool that supports intricate designs. By utilizing these tools, businesses can create impactful Journey Map Visualizations that truly reflect the customer experience derived from transcripts.
💬 Questions about How to visualize journey maps from transcripts?
Our team typically responds within minutes