How to visualize journey maps from user testing interviews
-
Bella Williams
- 10 min read
User Journey Visualization begins with understanding the experiences users face during their interactions with a product or service. By conducting user testing interviews, you can uncover insights into user behavior, preferences, and pain points. These narratives serve as the foundation for crafting accurate journey maps that depict each stage of the user's experience, from initial research to decision-making.
To create effective visualizations from user testing, it's essential to analyze the data collected and identify key touchpoints. Highlighting these critical moments will not only clarify the user's path but also enhance understanding among stakeholders. Ultimately, User Journey Visualization promotes empathy, enabling teams to design better experiences that meet user needs and expectations.
Extract insights from Customer & Employee Interviews. At Scale.

The Process of User Journey Visualization
User Journey Visualization begins with deciphering the data collected from user testing interviews. This process transforms raw insights into a visual narrative of the user’s experience. The first step is to identify key touchpoints, pain points, and emotional reactions along the user journey. By focusing on these elements, you can create a storyboard that illustrates the user's interactions with your product or service.
Next, it’s essential to organize the collected data methodically. This involves categorizing feedback based on user emotions and actions at each stage. Crafting a visual journey map allows stakeholders to see the complete picture, fostering a collaborative approach to problem-solving. By mapping these experiences, you highlight areas for improvement and identify opportunities for enhancing user satisfaction and loyalty. Ultimately, an effective User Journey Visualization aids in aligning strategies to better meet user needs and expectations.
Gathering Insights for User Journey Visualization
To create an effective User Journey Visualization, it is crucial to gather meaningful insights from user testing interviews. By compiling and analyzing the data collected during these interviews, patterns and themes begin to emerge, creating a foundation for understanding user experiences. Identifying key pain points and preferences allows teams to tailor their designs to better meet user needs, ultimately enhancing the overall experience.
A systematic approach is essential for extracting these insights. First, categorize the data from interviews into themes, such as customer needs and challenges. Next, analyze the frequency of mentioned pain points to highlight the most pressing issues. Finally, visualize these findings through charts or journey maps to share with stakeholders. This process transforms raw data into actionable insights, paving the way for impactful user journey representations. By prioritizing user feedback, organizations can create a more user-centric design strategy.
Mapping Out User Experiences Effectively
Understanding how to map out user experiences effectively is crucial for continuous improvement. When it comes to User Journey Visualization, this process begins with identifying key touchpoints throughout the user's interaction with your product. Start by gathering data from user testing interviews, focusing on what users experience and how they feel during each phase of their journey. This will provide context to the visualization while highlighting pain points that need addressing.
Next, construct the journey map, detailing the steps users take from initial awareness to final decision-making. Incorporate insights gathered to create a narrative that accurately reflects the user experience. Emphasize both positive and negative interactions, proposing actionable recommendations based on this analysis. This approach not only clarifies user needs but also enables your team to design effective solutions that enhance overall satisfaction. Ultimately, a well-crafted user journey map transforms raw interview data into meaningful insights for improvement.
Tools for Visualizing Journey Maps
To effectively visualize user journeys, various tools can help transform raw data into compelling representations. These tools are designed to illustrate the entire customer experience, from initial research to product use, allowing teams to pinpoint friction points and identify opportunities for improvement. They facilitate user journey visualization by converting qualitative insights into structured formats, making it easier to analyze user behavior over time.
Some popular tools available for journey mapping include Miro, which offers collaborative canvases; Lucidchart, known for its diagramming capabilities; UXPressia, tailored for customer journey maps; and Smaply, which provides in-depth user experience analysis. Each of these platforms features unique functionalities that can cater to different needs, whether your goal is to enhance communication with stakeholders or to generate insightful, actionable recommendations. By selecting the right tool, teams can create visual narratives that effectively depict the user's experience and enhance decision-making processes.
Generate Journey maps, Mind maps, Bar charts and more from your data in Minutes
Insight7: The Essential Tool for Journey Mapping
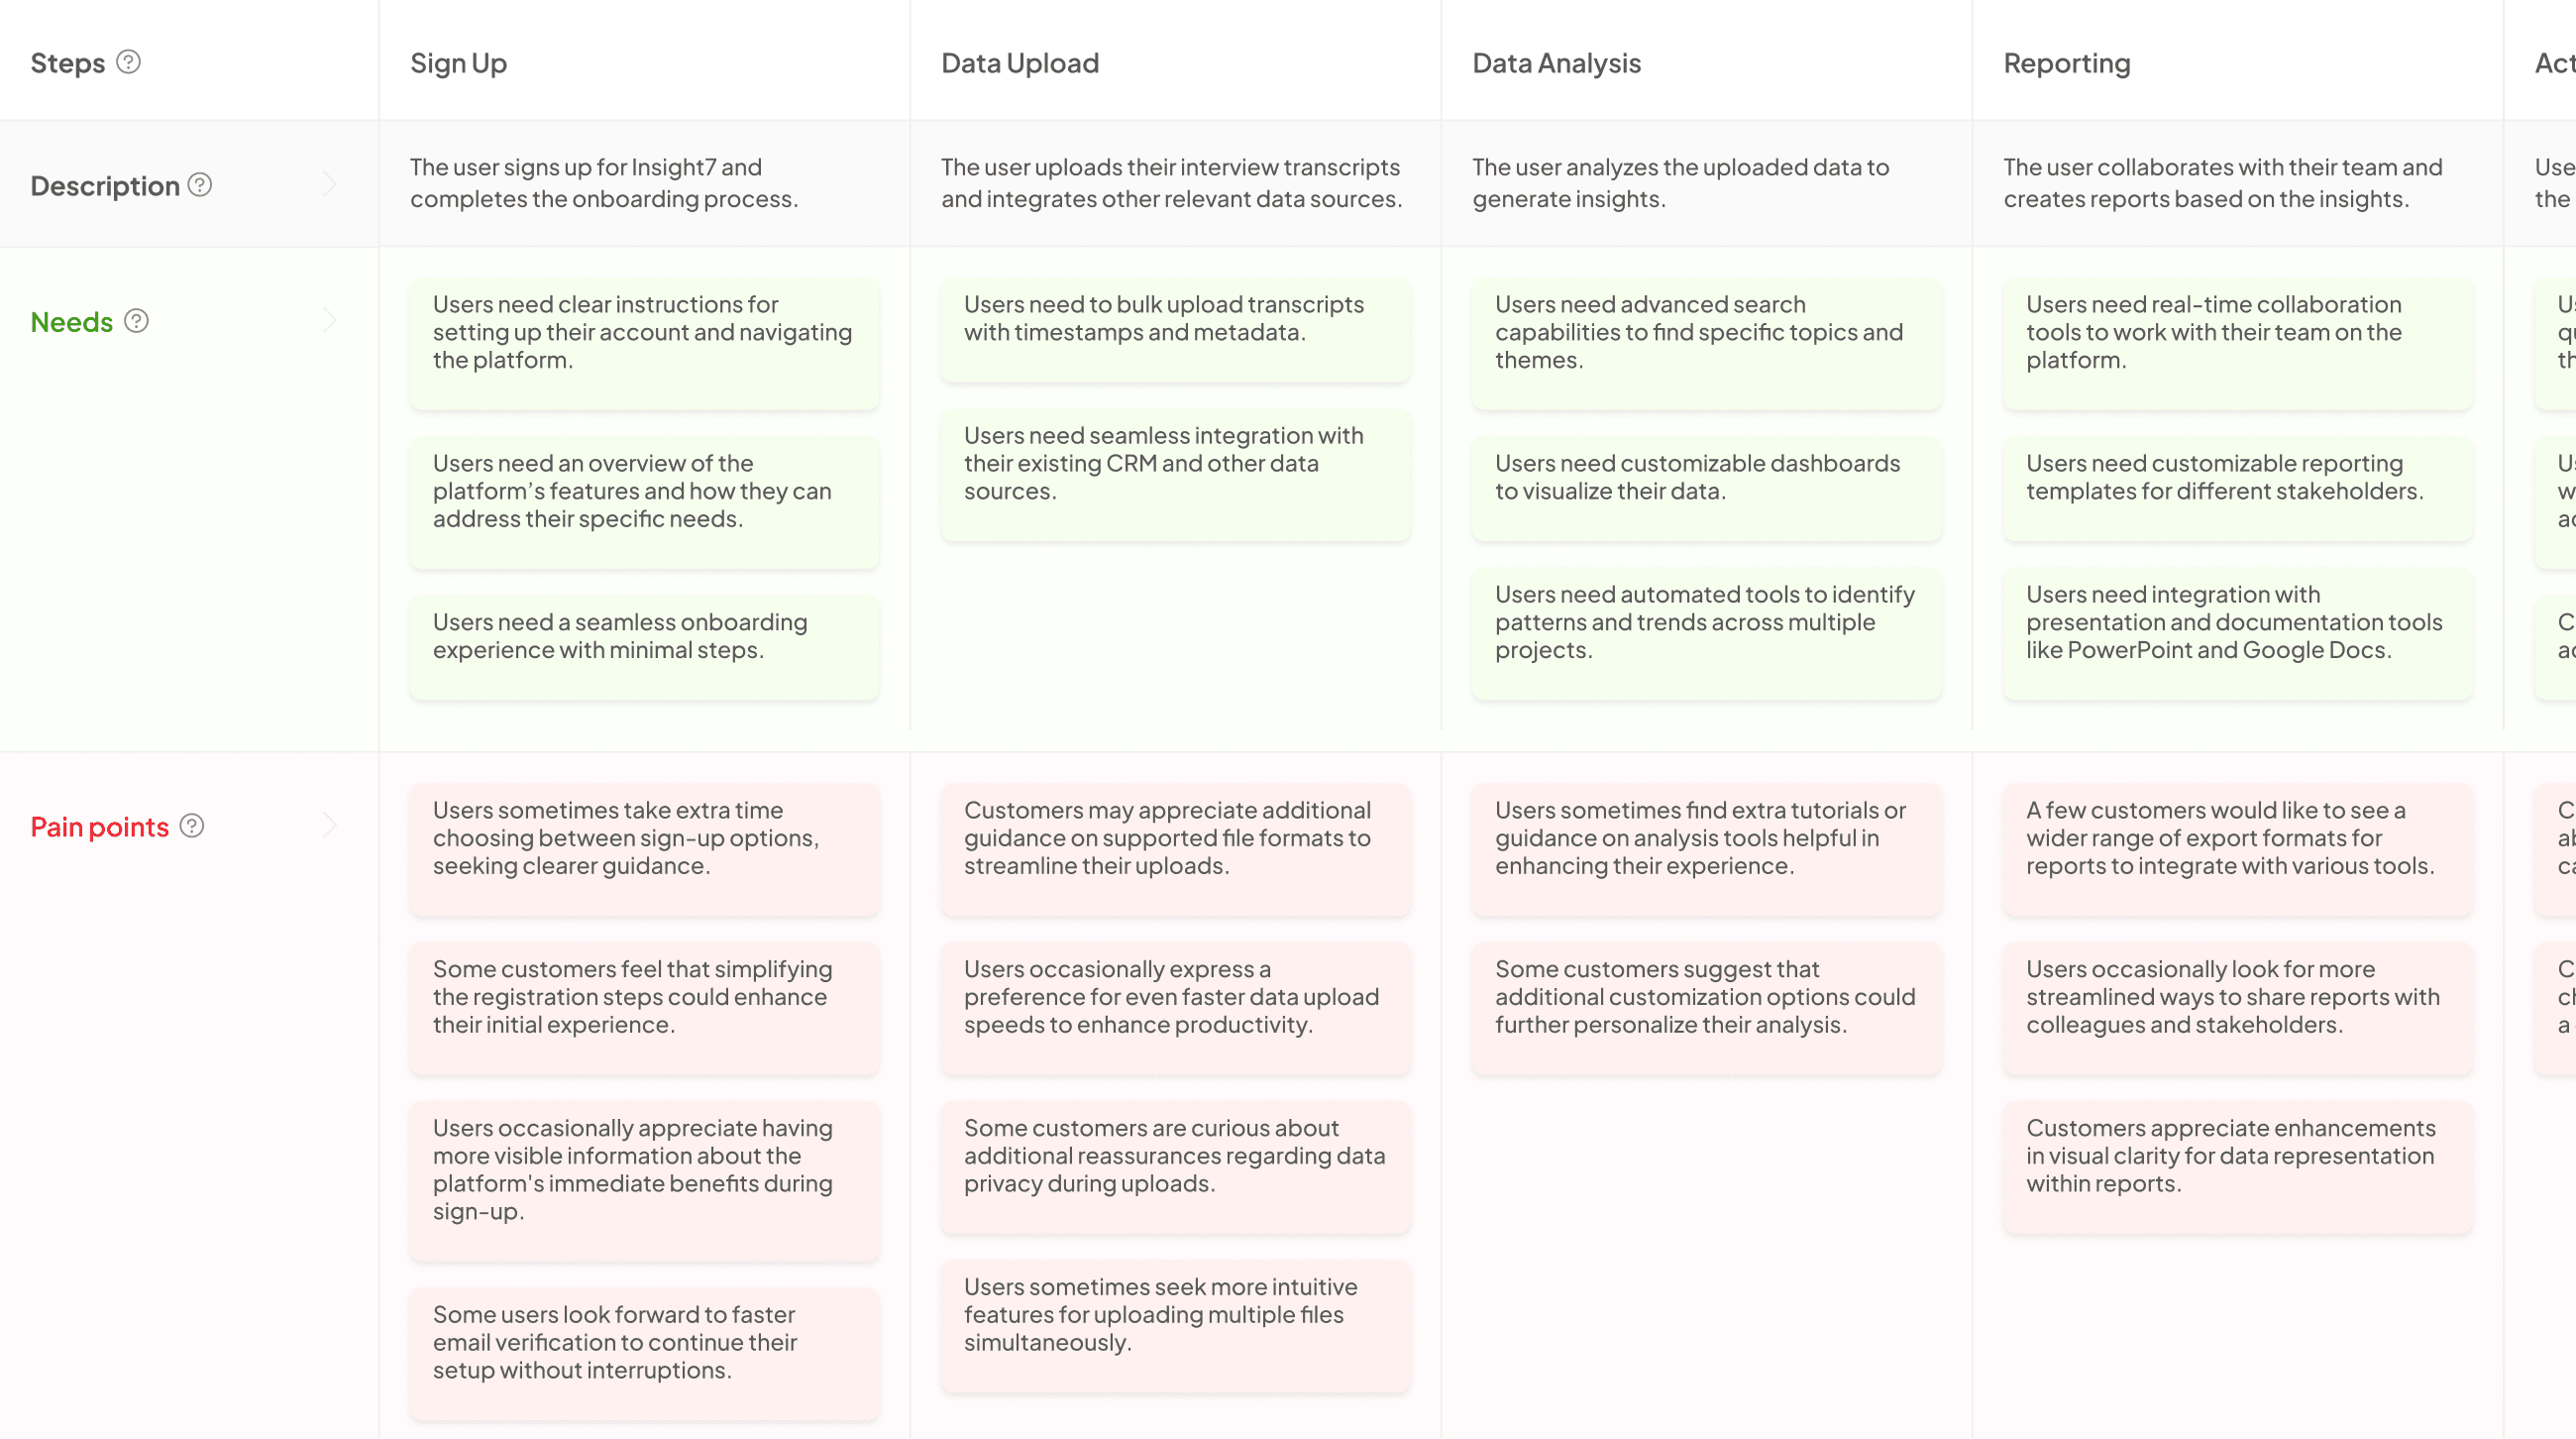
Creating an effective user journey visualization begins with a clear understanding of the experiences your users go through. Insight7 stands out as an essential tool for journey mapping, offering an intuitive interface designed for ease of use. This democratization of data allows team members from various backgrounds to engage with insights, fostering collaborative efforts to enhance customer experiences.
The platform enables users to consolidate data from multiple interviews, easily identifying pain points and desires. By visualizing this information, teams can develop comprehensive journey maps that truly reflect customer sentiment and behavior. The integration of voice of the customer insights adds depth to these visuals, ensuring that decision-makers are grounded in real user experiences. Moreover, the efficiency in analyzing large sets of data provides actionable insights, making Insight7 an invaluable resource in the journey mapping process.
Other Tools to Enhance User Journey Visualization
To enhance user journey visualization, integrating a variety of tools can significantly improve how insights are represented. For example, Miro offers versatile canvases for collaborative brainstorming and journey mapping, allowing teams to visualize complex processes in real-time. With its intuitive interface, users can create and modify journey maps while easily sharing their insights with stakeholders.
Another valuable resource is Lucidchart, which provides extensive templates designed for journey mapping. It enables users to depict various touchpoints and experiences seamlessly. UXPressia focuses on user-centered designs, offering a clear way to gather data and visualize customer journeys, making the process user-friendly. Lastly, Smaply specializes in creating detailed maps that include personas and stakeholder information, enriching the user journey visualization process. These tools collectively empower teams to clarify user experiences and identify areas for improvement.
💬 Questions about How to visualize journey maps from user testing interviews?
Our team typically responds within minutes
- Miro
Miro is an indispensable tool for user journey visualization, enhancing collaboration and understanding among team members. Its intuitive interface allows users to create journey maps effortlessly, bringing together insights from user testing interviews. By utilizing Miro’s features, you can visually organize feedback and document user experiences in real time, making it easier to identify pain points and opportunities for improvement. This collaborative environment fosters teamwork, enabling stakeholders to contribute their perspectives effectively.
To make the most of Miro for user journey visualization, consider these approaches:
User-Centric Templates: Utilize Miro’s pre-existing templates tailored for journey mapping. These provide a structured foundation, helping you visualize the user experience systematically.
Real-Time Collaboration: Engage team members in live sessions to discuss insights and make edits simultaneously. This fosters immediate feedback and enhances collective understanding.
Integration Options: Connect Miro with other tools you use, allowing seamless data transfer and maintaining a centralized location for insights.
By applying these approaches, Miro becomes a powerful asset in visualizing user journeys, facilitating a comprehensive understanding of user experiences.
- Lucidchart
Lucidchart serves as a powerful platform for User Journey Visualization, transforming complex data into clear, actionable visuals. This tool allows teams to collaboratively map out user experiences, making it accessible even for those without technical expertise. By integrating various shapes, icons, and connections, Lucidchart helps visualize the pathways users take, highlighting critical touchpoints along their journey.
Using this platform, teams can easily create diagrams that showcase user interactions, identify pain points, and visualize insights gained from user testing interviews. The collaborative features enable multiple stakeholders to contribute simultaneously, fostering a shared understanding of user needs. Furthermore, Lucidchart's integration capabilities with other tools streamline data import, ensuring a seamless experience in user journey mapping. Overall, using Lucidchart not only informs design decisions but also enhances communication within teams, making it an invaluable asset in the User Journey Visualization process.
- UXPressia
The tool focuses on streamlining the user journey visualization process. It provides an easily accessible interface for teams to transform raw data from user testing interviews into meaningful journey maps. Users can quickly upload interview recordings and transcripts, and the platform automatically identifies key pain points and insights. This feature facilitates an efficient analysis of user experiences, allowing teams to spot friction and enhance the overall customer journey.
Its capabilities extend beyond just individual analyses. Users can compile multiple projects into a cohesive view, making it possible to visualize patterns and themes across various interviews. This not only promotes collaboration among team members but also helps in making informed decisions based on comprehensive insights. Ultimately, this approach democratizes user journey visualization, enabling anyone in the organization to actively participate in the journey mapping process without requiring extensive training or expertise.
- Smaply
Smaply offers a powerful interface for User Journey Visualization, enabling teams to seamlessly create journey maps from user testing interviews. By facilitating a visual representation of user experiences, it allows for deeper understanding and analysis of the data collected from interviews. With its user-friendly features, teams can capture insights that highlight pain points, emotions, and touchpoints throughout the customer journey.
The platform is particularly beneficial when it comes to collaborative mapping. Users can easily share and gather feedback on journey maps, fostering a dialogue among team members. Additionally, Smaply supports the integration of various data sources, making it easier to incorporate findings from different user testing sessions. This flexibility not only aids in refining user personas but also strengthens the overall design thinking process. By leveraging Smaply, businesses can transform raw data into actionable insights, ultimately leading to improved user experiences.
Conclusion on User Journey Visualization from Interviews
User Journey Visualization from interviews provides crucial insights into the steps users take during their experiences. By synthesizing the data collected, teams can create visual representations that highlight pain points, needs, and behaviors throughout the user journey. This visualization not only reveals where users struggle but also offers clear opportunities for improvement.
Understanding these user experiences fosters a more empathetic approach to product development. When teams can visualize the journey, they gain a deeper appreciation for user perspectives. Ultimately, this conclusion underscores the importance of effective user journey visualization in driving meaningful enhancements that meet customer expectations and needs.
💬 Questions about How to visualize journey maps from user testing interviews?
Our team typically responds within minutes


