
In today's data-driven business landscape, the top free analytics tools have become indispensable for organizations seeking to unlock valuable insights without breaking the bank. As businesses of all sizes recognize the power of data-driven decision-making, the demand for accessible and cost-effective analytics solutions has skyrocketed. This article explores the best free options available to business intelligence analysts, data analysts, and customer insight professionals looking to harness the potential of their data.
From open-source platforms to freemium models offered by industry giants, we'll delve into the diverse array of tools that can help you visualize data, perform statistical analysis, and generate actionable reports. Whether you're a startup on a tight budget or a large corporation looking to complement existing paid solutions, these free analytics tools can provide powerful capabilities to enhance your data analysis processes and drive informed business strategies.
Why Free Analytics Tools Matter for Analysts
In today's data-driven business environment, analysts face the challenge of extracting valuable insights from vast amounts of information. While many powerful analytics tools come with hefty price tags, free options can be just as effective for many tasks. These accessible tools empower analysts to perform complex data analysis, create stunning visualizations, and uncover hidden patterns without breaking the bank.
For business intelligence and data analysts, utilizing free analytics tools offers several advantages. Firstly, it allows for experimentation with different methodologies and techniques without financial risk. Secondly, these tools often have robust user communities, providing support and shared knowledge. Lastly, mastering free tools can enhance an analyst's skill set, making them more versatile and valuable to their organizations. By embracing top free analytics solutions, analysts can drive informed decision-making and deliver impactful results, regardless of budget constraints.
Overview of Top Free Analytics Tools
In today's data-driven business landscape, analytics tools are essential for deriving actionable insights. Fortunately, several top-notch free analytics platforms offer robust features without breaking the bank. These tools cater to various needs, from basic website tracking to advanced data visualization and reporting.
For business analysts and data professionals seeking cost-effective solutions, exploring free analytics options can be a game-changer. These platforms often provide comprehensive functionalities, including real-time data analysis, customizable dashboards, and integration capabilities with other business systems. By leveraging these free resources, organizations can make informed decisions, optimize processes, and gain a competitive edge without significant financial investment.
Comprehensive Analytics Tools
In the realm of data analysis, cost-effective solutions are highly sought after. Many businesses and analysts are turning to free analytics tools to gain valuable insights without breaking the bank. These tools offer a range of features that rival their paid counterparts, making them attractive options for organizations of all sizes.
When exploring the top free analytics options, it's essential to consider factors such as ease of use, data visualization capabilities, and integration potential. Some popular choices include Google Analytics, which provides comprehensive website traffic analysis, and RapidMiner, offering advanced data mining and machine learning functionalities. Another noteworthy option is Apache Spark, an open-source analytics engine known for its speed and scalability. By leveraging these free tools, analysts can extract meaningful insights from their data, drive informed decision-making, and optimize business strategies without incurring additional costs.
Google Analytics: A Staple in Web Analytics
Google Analytics stands as a cornerstone in the realm of web analytics, offering a comprehensive suite of tools at no cost. This powerful platform provides businesses and website owners with invaluable insights into their online presence. By tracking visitor behavior, traffic sources, and user engagement, Google Analytics empowers decision-makers to make data-driven choices.
One of the key strengths of Google Analytics lies in its ability to present complex data in easily digestible formats. Through customizable dashboards and reports, users can visualize trends and patterns that might otherwise remain hidden. Moreover, its integration with other Google services, such as Google Ads and Search Console, creates a seamless ecosystem for digital marketers. As a free tool, Google Analytics continues to be an essential resource for organizations seeking to understand and optimize their online performance.
Key Features of Google Analytics
Google Analytics stands out as a powerhouse among free data analytics tools, offering a comprehensive suite of features for businesses and analysts alike. At its core, it provides robust website traffic analysis, allowing users to track visitor behavior, engagement metrics, and conversion rates. This invaluable information helps organizations make data-driven decisions to optimize their online presence.
One of Google Analytics' key strengths is its ability to segment audiences based on various criteria, such as demographics, interests, and browsing habits. This granular approach enables businesses to tailor their marketing strategies and content to specific user groups, enhancing overall effectiveness. Additionally, the tool's real-time reporting feature gives instant insights into current website activity, allowing for quick adjustments to campaigns or content as needed. With its integration capabilities and customizable dashboards, Google Analytics empowers analysts to extract meaningful insights and present them in easily digestible formats for stakeholders across the organization.
Best Practices for Using Google Analytics
Google Analytics stands out as a powerhouse among free data analytics tools, offering robust features for businesses of all sizes. As a business intelligence analyst, you'll find its user-friendly interface and comprehensive reporting capabilities invaluable for tracking website performance and user behavior.
To maximize the benefits of Google Analytics, start by setting up clear goals and conversion tracking. This allows you to measure the effectiveness of your marketing campaigns and identify areas for improvement. Next, utilize custom dashboards to visualize key metrics at a glance, saving time and enhancing data interpretation. Don't overlook the power of audience segmentation, which enables you to analyze specific user groups and tailor your strategies accordingly. Lastly, integrate Google Analytics with other tools like Google Ads and Search Console for a holistic view of your digital presence, empowering you to make data-driven decisions that boost your business's online performance.
Microsoft Power BI: Robust and Versatile
Microsoft Power BI stands out as a robust and versatile option among free data analytics tools. This powerful platform offers a comprehensive suite of features that cater to the needs of business intelligence professionals and data analysts alike. With its user-friendly interface and extensive visualization capabilities, Power BI enables users to transform raw data into meaningful insights effortlessly.
One of the key strengths of Power BI is its seamless integration with other Microsoft products, making it an ideal choice for organizations already using the Microsoft ecosystem. The tool's ability to connect to various data sources, from Excel spreadsheets to cloud-based databases, provides analysts with unparalleled flexibility in data management. Moreover, Power BI's advanced analytics features, including AI-powered insights and natural language querying, empower users to uncover hidden patterns and trends in their data, driving informed decision-making across the business.
Key Features of Power BI
Power BI stands out as a robust data visualization tool, offering a suite of features that cater to various analytical needs. At its core, Power BI excels in transforming raw data into interactive dashboards and reports. Users can connect to numerous data sources, from simple Excel spreadsheets to complex databases, ensuring comprehensive data integration.
One of Power BI's key strengths lies in its intuitive drag-and-drop interface, allowing users to create visually appealing charts and graphs with ease. The tool also boasts advanced data modeling capabilities, enabling analysts to establish relationships between different datasets and perform complex calculations. Moreover, Power BI's natural language query feature, called Q&A, empowers users to ask questions about their data in plain English and receive instant visualizations as answers. This democratization of data analysis makes Power BI an invaluable asset for organizations seeking to foster a data-driven culture across all levels of expertise.
Best Practices for Using Power BI
Power BI, a powerful data visualization tool, offers numerous features for effective data analysis. To maximize its potential, follow these best practices:
Clean and prepare your data: Ensure your datasets are accurate and well-structured before importing them into Power BI. This step is crucial for creating reliable visualizations and insights.
Use appropriate visualizations: Choose the right chart types to represent your data effectively. Bar charts work well for comparisons, while line graphs are ideal for showing trends over time.
Implement consistent formatting: Maintain a cohesive look across your reports by using consistent colors, fonts, and layouts. This enhances readability and professionalism.
Leverage DAX functions: Utilize Data Analysis Expressions (DAX) to create custom calculations and measures, enabling more advanced analysis and insights.
Optimize performance: Keep your reports running smoothly by minimizing the use of complex calculations and large datasets. Consider using aggregations and incremental refreshes for better performance.
By adhering to these best practices, you can create impactful Power BI reports that effectively communicate your data insights to stakeholders and decision-makers.
Specialized Analytics Tools
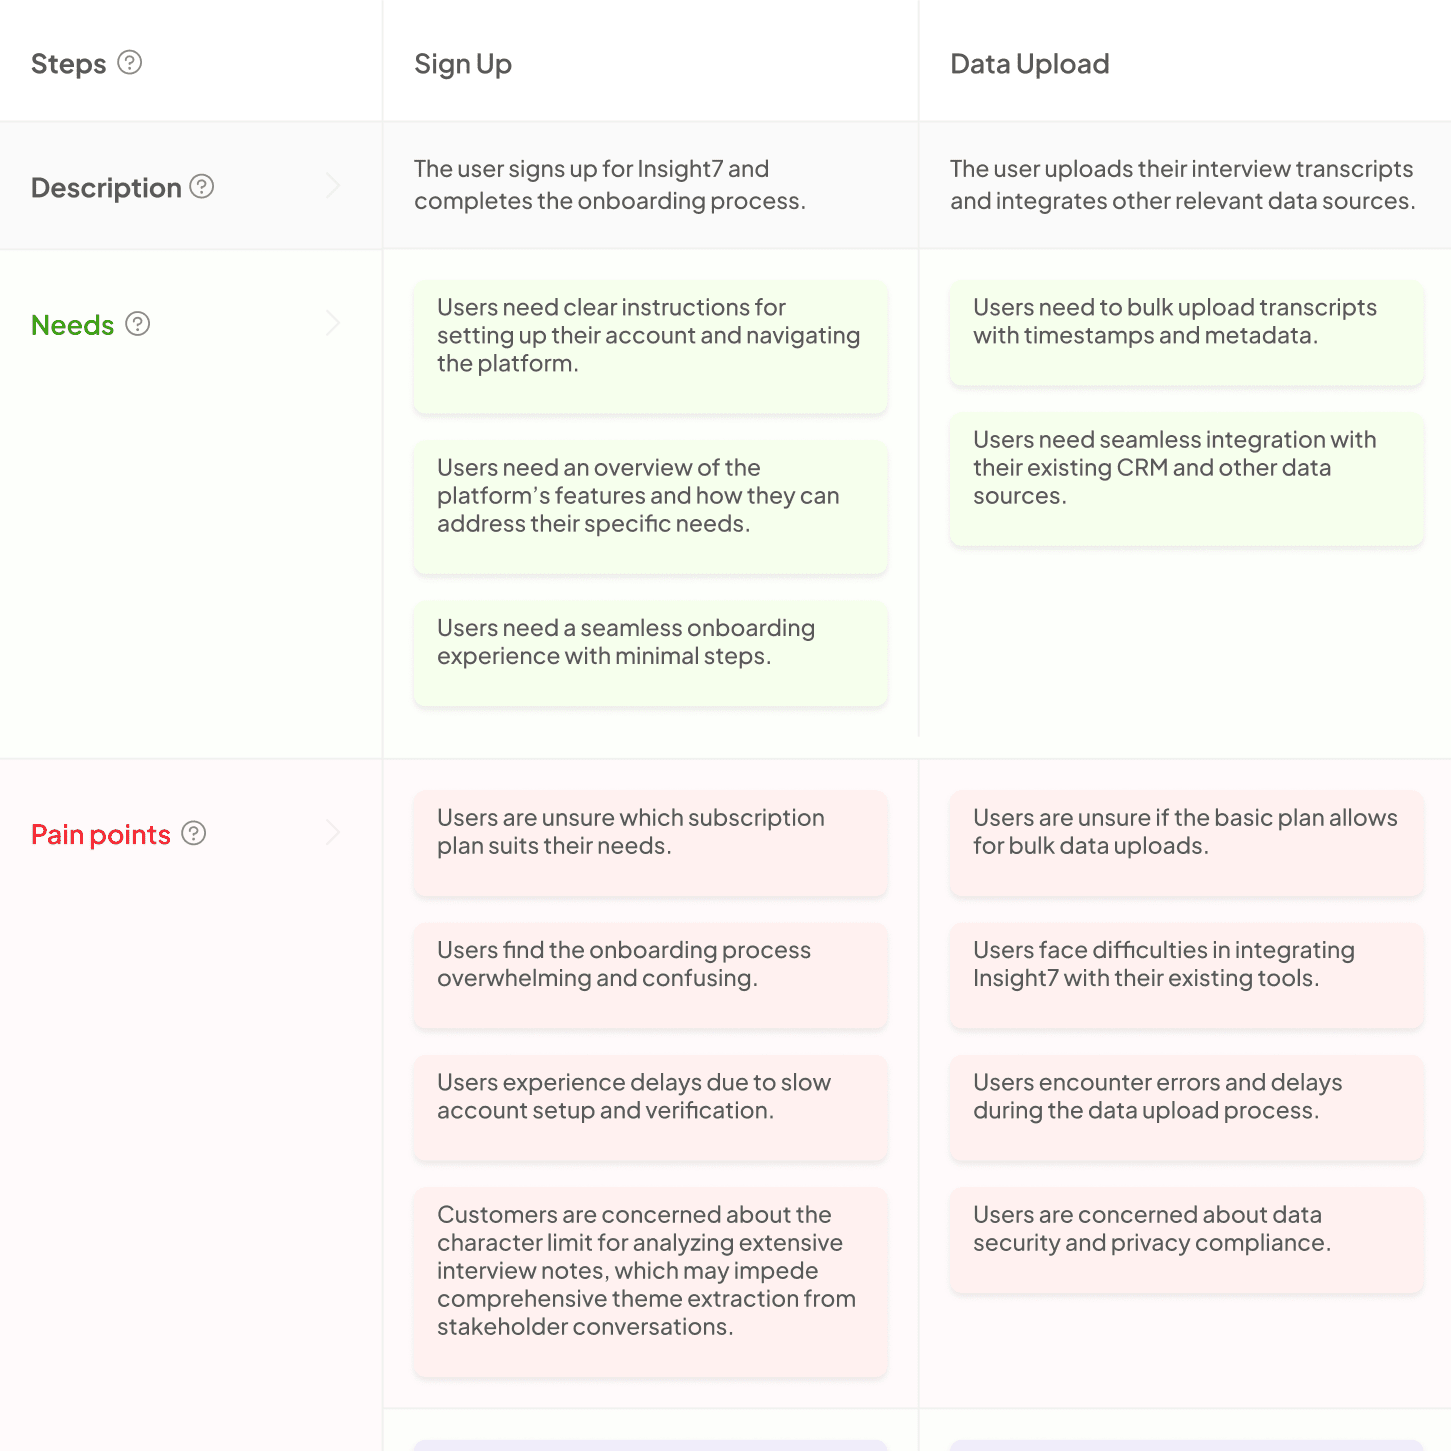
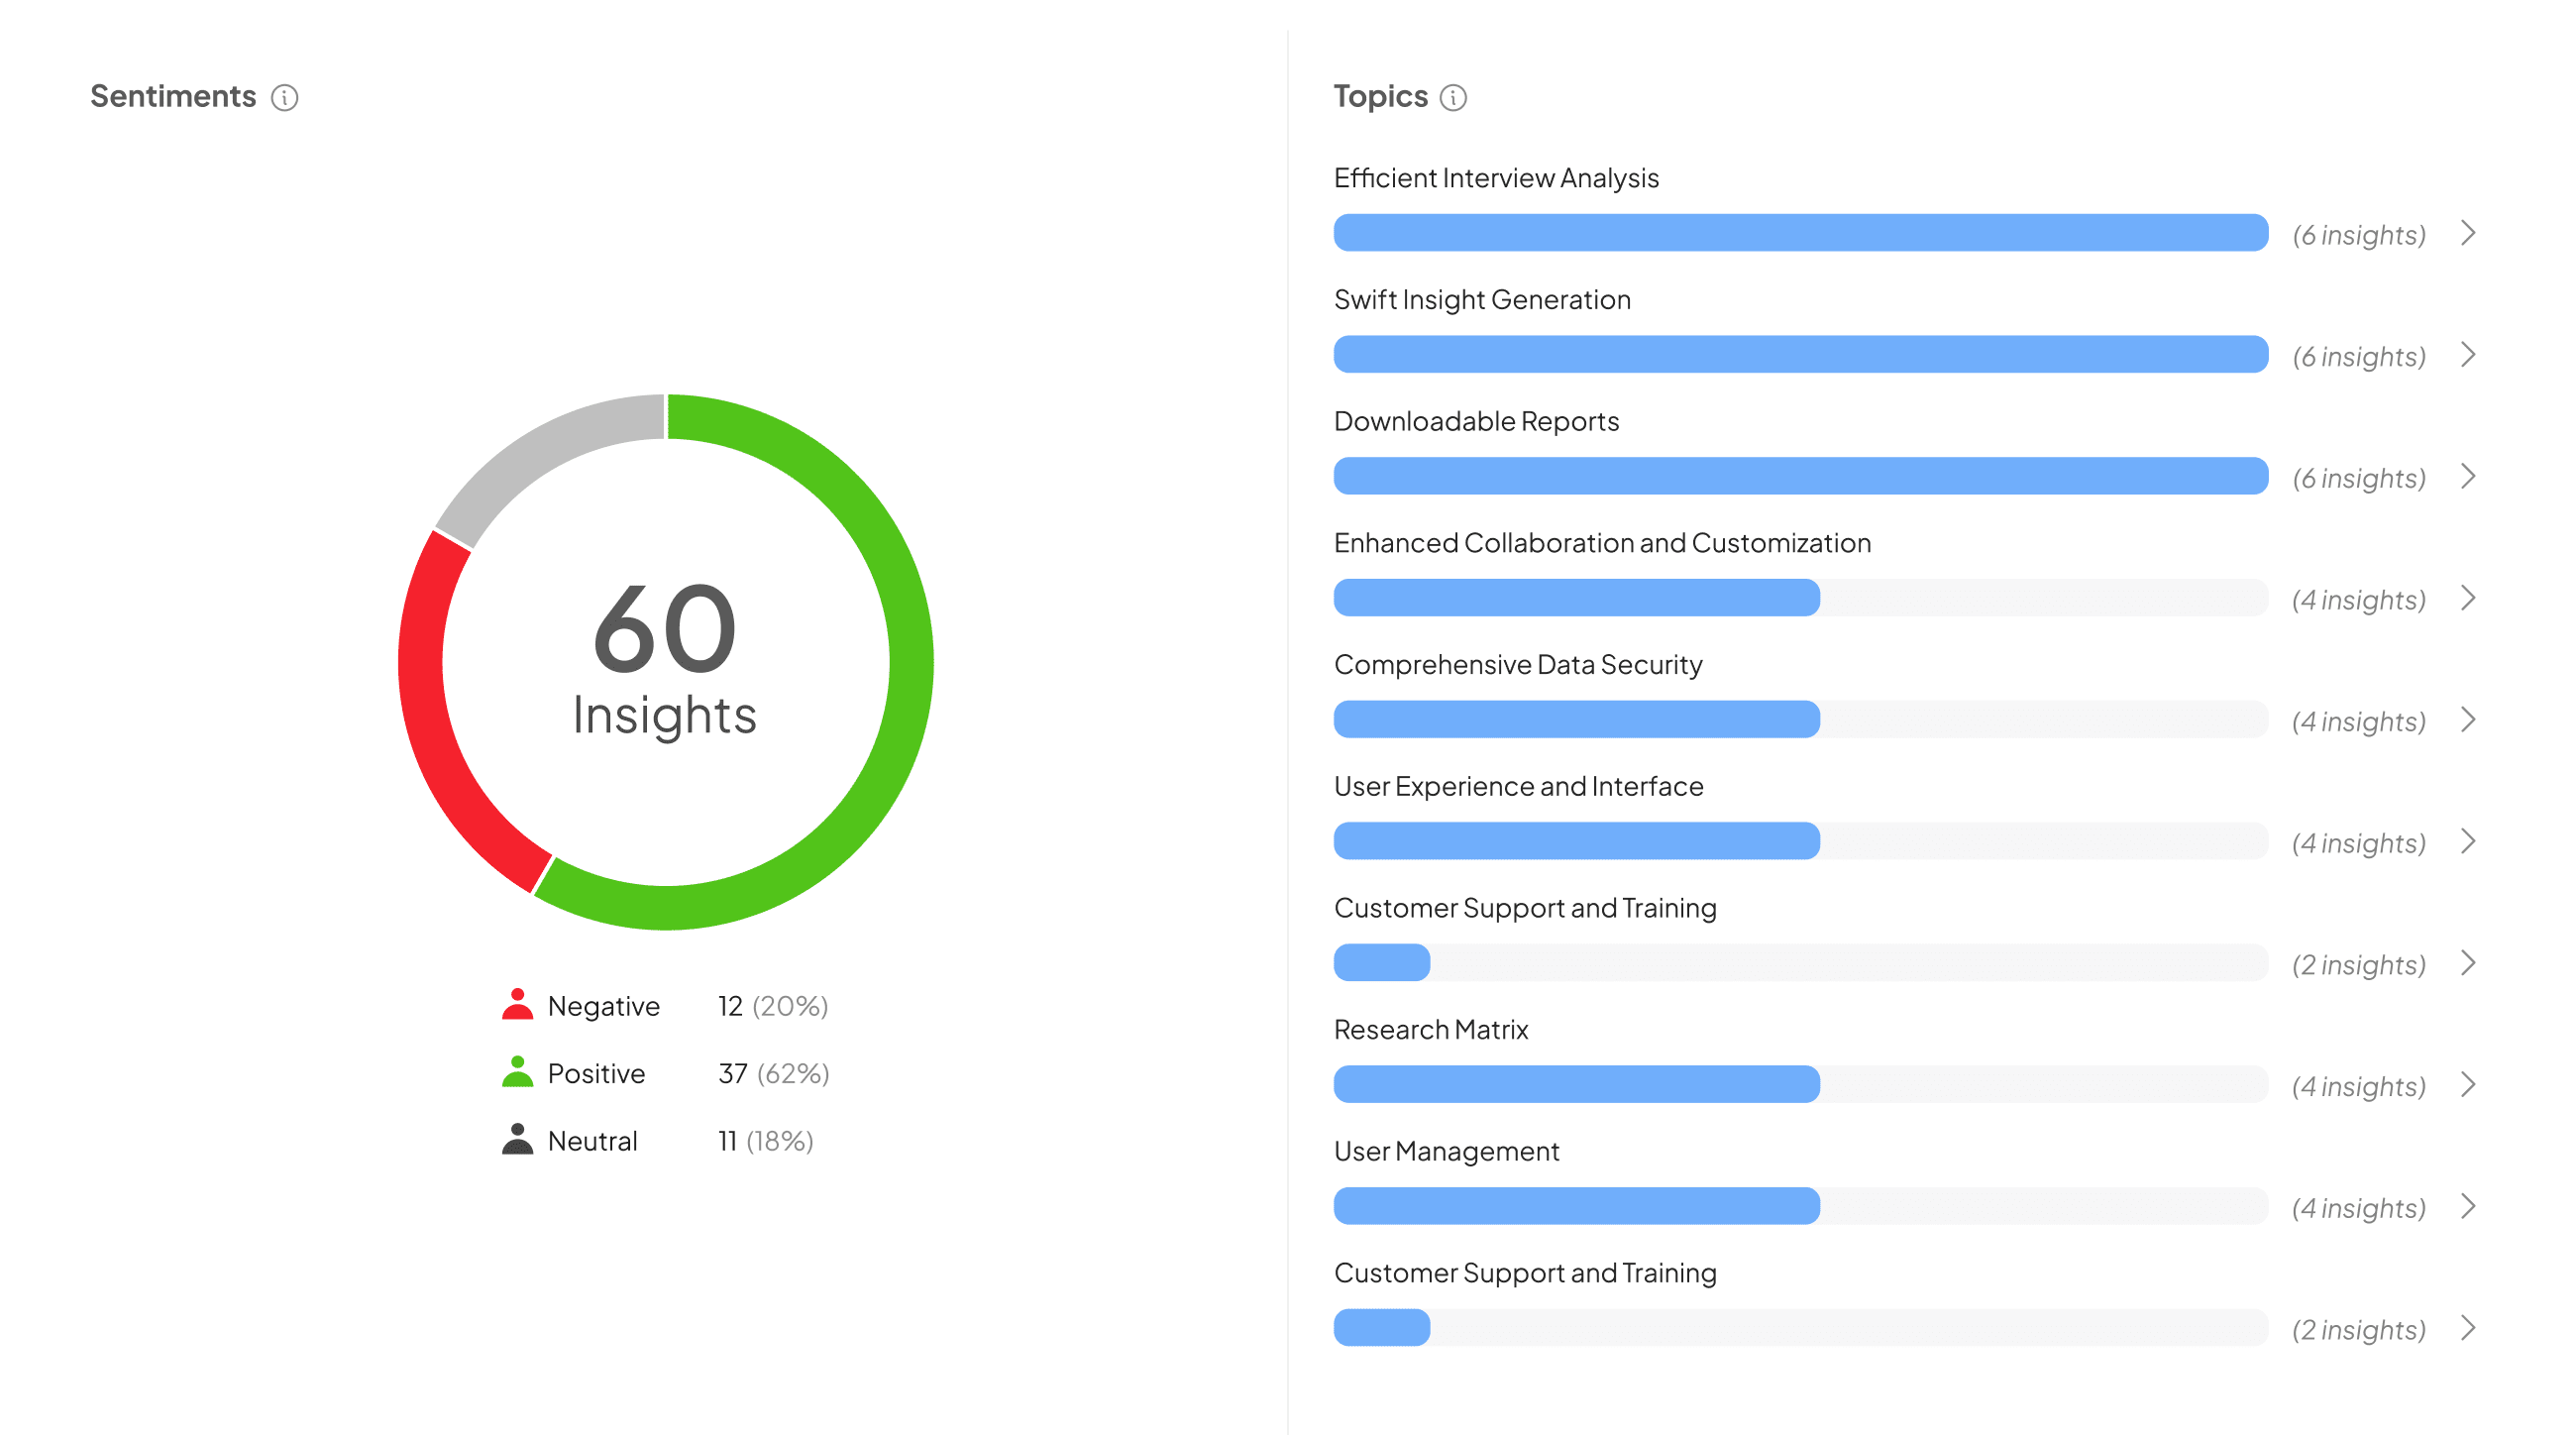
In the realm of specialized analytics tools, user-friendliness has become a paramount feature. Advanced platforms now offer sophisticated qualitative analytics capabilities while prioritizing ease of use. These tools are designed to abstract complex functionalities, making them accessible to a broader audience beyond experienced researchers.
One standout example in this category is a tool that excels in analyzing interview transcripts at scale. Customers praise it as the most sophisticated qualitative analytics tool they've encountered. What sets it apart is its ability to balance powerful capabilities with an intuitive interface. This approach democratizes data analysis, allowing professionals from various backgrounds to harness insights without extensive technical expertise. By simplifying complex processes, such tools empower businesses to make data-driven decisions more efficiently and effectively.
Top Free Analytics Tools for Social Media
In today's digital landscape, businesses are constantly seeking ways to gain insights from their social media presence. Fortunately, there are numerous free analytics tools available that can help organizations track, measure, and optimize their social media performance. These tools offer valuable data on audience engagement, content reach, and overall campaign effectiveness without breaking the bank.
For business intelligence and data analysts looking to dive deep into social media metrics, several top free analytics options stand out. Google Analytics, while primarily known for website tracking, also provides robust social media reporting features. It allows users to monitor traffic from various social platforms and track conversions originating from social media campaigns. Another powerful tool is Hootsuite's free plan, which offers basic analytics for multiple social networks in one dashboard. This centralized approach enables analysts to compare performance across different platforms and identify trends more efficiently.
Hootsuite: Managing Multiple Platforms
Hootsuite stands out as a powerful tool for managing multiple social media platforms from a single dashboard. This versatile platform allows users to schedule posts, monitor engagement, and analyze performance across various social networks. For businesses and marketers juggling multiple accounts, Hootsuite offers a centralized solution to streamline their social media efforts.
One of Hootsuite's key features is its ability to provide analytics insights across different platforms. Users can track metrics such as follower growth, post reach, and engagement rates, all within a unified interface. This comprehensive view enables data-driven decision-making, helping businesses refine their social media strategies and optimize their online presence. While Hootsuite offers paid plans with advanced features, its free tier still provides valuable analytics tools for those looking to dip their toes into social media management without a significant financial commitment.
Buffer: Streamlining Social Media Analytics
Buffer stands out as a powerful free tool for businesses seeking to optimize their social media analytics. This platform offers a comprehensive suite of features that enable users to track engagement metrics, analyze post performance, and gain valuable insights into audience behavior across multiple social networks. With its user-friendly interface, Buffer simplifies the process of scheduling posts and measuring their impact, allowing teams to make data-driven decisions effortlessly.
One of Buffer's key strengths lies in its ability to provide detailed analytics reports for each social media platform. Users can easily access metrics such as reach, impressions, clicks, and shares, helping them understand which content resonates most with their audience. Additionally, Buffer's analytics tools offer valuable demographic information, enabling businesses to tailor their social media strategies to specific target groups. By leveraging these insights, companies can refine their content approach and maximize their social media ROI without breaking the bank.
Top Free Analytics Tools for Customer Insights
In today's data-driven business landscape, leveraging free analytics tools can provide valuable customer insights without breaking the bank. For business intelligence and customer insight analysts, these tools offer a cost-effective way to extract meaningful information from vast datasets. Let's explore some of the top free analytics options that can revolutionize your data analysis process and help you make informed decisions.
Google Analytics stands out as a powerful, user-friendly tool for tracking website traffic and user behavior. It provides detailed reports on visitor demographics, acquisition channels, and engagement metrics. Another excellent option is R, an open-source programming language widely used for statistical computing and data visualization. R's extensive library of packages allows analysts to perform complex analyses and create stunning visualizations. For those seeking a more intuitive interface, Tableau Public offers a free version of its popular data visualization software, enabling users to create interactive dashboards and share them online.
Mixpanel: Deep Dive into User Behavior
Mixpanel stands out as a powerful tool for diving deep into user behavior, offering robust analytics capabilities even in its free tier. This platform excels at tracking user interactions across websites and mobile apps, providing granular insights into how people engage with digital products. With Mixpanel, analysts can create custom event tracking, segment users based on specific actions, and visualize data through intuitive dashboards.
One of Mixpanel's key strengths is its ability to create funnels, allowing businesses to map out and analyze user journeys step-by-step. This feature helps identify drop-off points and optimize conversion paths. Additionally, Mixpanel's retention analysis tools enable teams to understand how well they're keeping users engaged over time, a crucial metric for sustainable growth. While the free version has some limitations on data points and retention period, it still offers substantial value for small to medium-sized businesses looking to make data-driven decisions.
Hotjar: Visualizing User Interactions
Hotjar stands out as a powerful tool for visualizing user interactions on websites and applications. This free analytics platform offers a unique heatmap feature that color-codes areas of high user engagement, providing invaluable insights into visitor behavior. By tracking clicks, scrolls, and mouse movements, Hotjar creates a visual representation of how users navigate through your digital content.
One of Hotjar's standout features is its session recording capability. This function allows analysts to replay user sessions, offering a firsthand view of the customer journey. By observing how real users interact with your site, you can identify pain points, usability issues, and opportunities for optimization. Additionally, Hotjar's feedback polls and surveys enable direct communication with users, gathering qualitative data to complement the quantitative insights from heatmaps and recordings. These features make Hotjar an essential tool for businesses seeking to enhance user experience and drive conversions without breaking the bank.
Conclusion: Maximizing the Potential of Free Analytics Tools
Free data analytics tools have revolutionized the way businesses approach data-driven decision-making. As we've explored various options throughout this article, it's clear that these tools offer powerful capabilities without the hefty price tag. From Google Analytics to Tableau Public, each platform provides unique features that cater to different analytical needs and skill levels.
While these free tools may have limitations compared to their paid counterparts, they still offer immense value for businesses and analysts looking to dive into data analysis. By combining multiple free tools, you can create a comprehensive analytics stack that rivals expensive enterprise solutions. As you embark on your data analytics journey, remember to choose tools that align with your specific goals and expertise level. With the right combination of free analytics tools, you'll be well-equipped to uncover valuable insights and drive informed business decisions.