
Free Visualization Tools open up a world of possibilities for individuals and businesses aiming to interpret data effectively. Imagine navigating through complex datasets, transforming raw numbers into engaging visuals that tell a compelling story. These tools democratize access to data visualization, making it achievable for anyone, regardless of their technical expertise.
Understanding how to utilize Free Visualization Tools is essential in today’s data-driven environment. By comparing various platforms, users can find the best fit for their needs, whether it’s for simple charts or sophisticated dashboards. These tools not only enhance data comprehension but also empower users to convey insights visually to diverse audiences.
Exploring the Basics
Understanding Free Visualization Tools is essential for anyone aiming to make their data more accessible and engaging. These tools provide various features that let users create insightful visuals, aiding in the interpretation of complex datasets. The ability to illustrate information visually helps uncover patterns, trends, and key metrics in your data, transforming raw numbers into narratives that resonate with your audience.
When exploring Free Visualization Tools, consider factors such as ease of use, customization options, and integration capabilities. Some tools may offer advanced features but come with steep learning curves. In contrast, others prioritize user-friendliness, making it easier for beginners to produce effective visuals quickly. Additionally, assess the types of visualizations available, as different tools can cater to various needs, be it charts, maps, or dashboards. By evaluating these aspects, you can identify the best tool that aligns with your specific data visualization goals.
What are Free Visualization Tools?
Free visualization tools are software applications that allow users to create visual representations of data without any cost. These tools empower individuals and organizations to transform raw data into charts, graphs, and infographics, making it easier to communicate insights and findings. They cater to diverse needs, from creating simple bar graphs to more complex visual dashboards.
Essentially, free visualization tools enable users to enhance their data storytelling capabilities. Their user-friendly interfaces and accessible features make them suitable for both beginners and experienced analysts. Common examples include tools that support interactive visualizations and templates specifically designed for various types of data. By utilizing these resources, users can effectively share their findings with stakeholders and make data-driven decisions without incurring additional expenses. Ultimately, these tools foster a data-driven culture by simplifying the analysis and presentation of information.
Importance of Data Visualization in Todays World
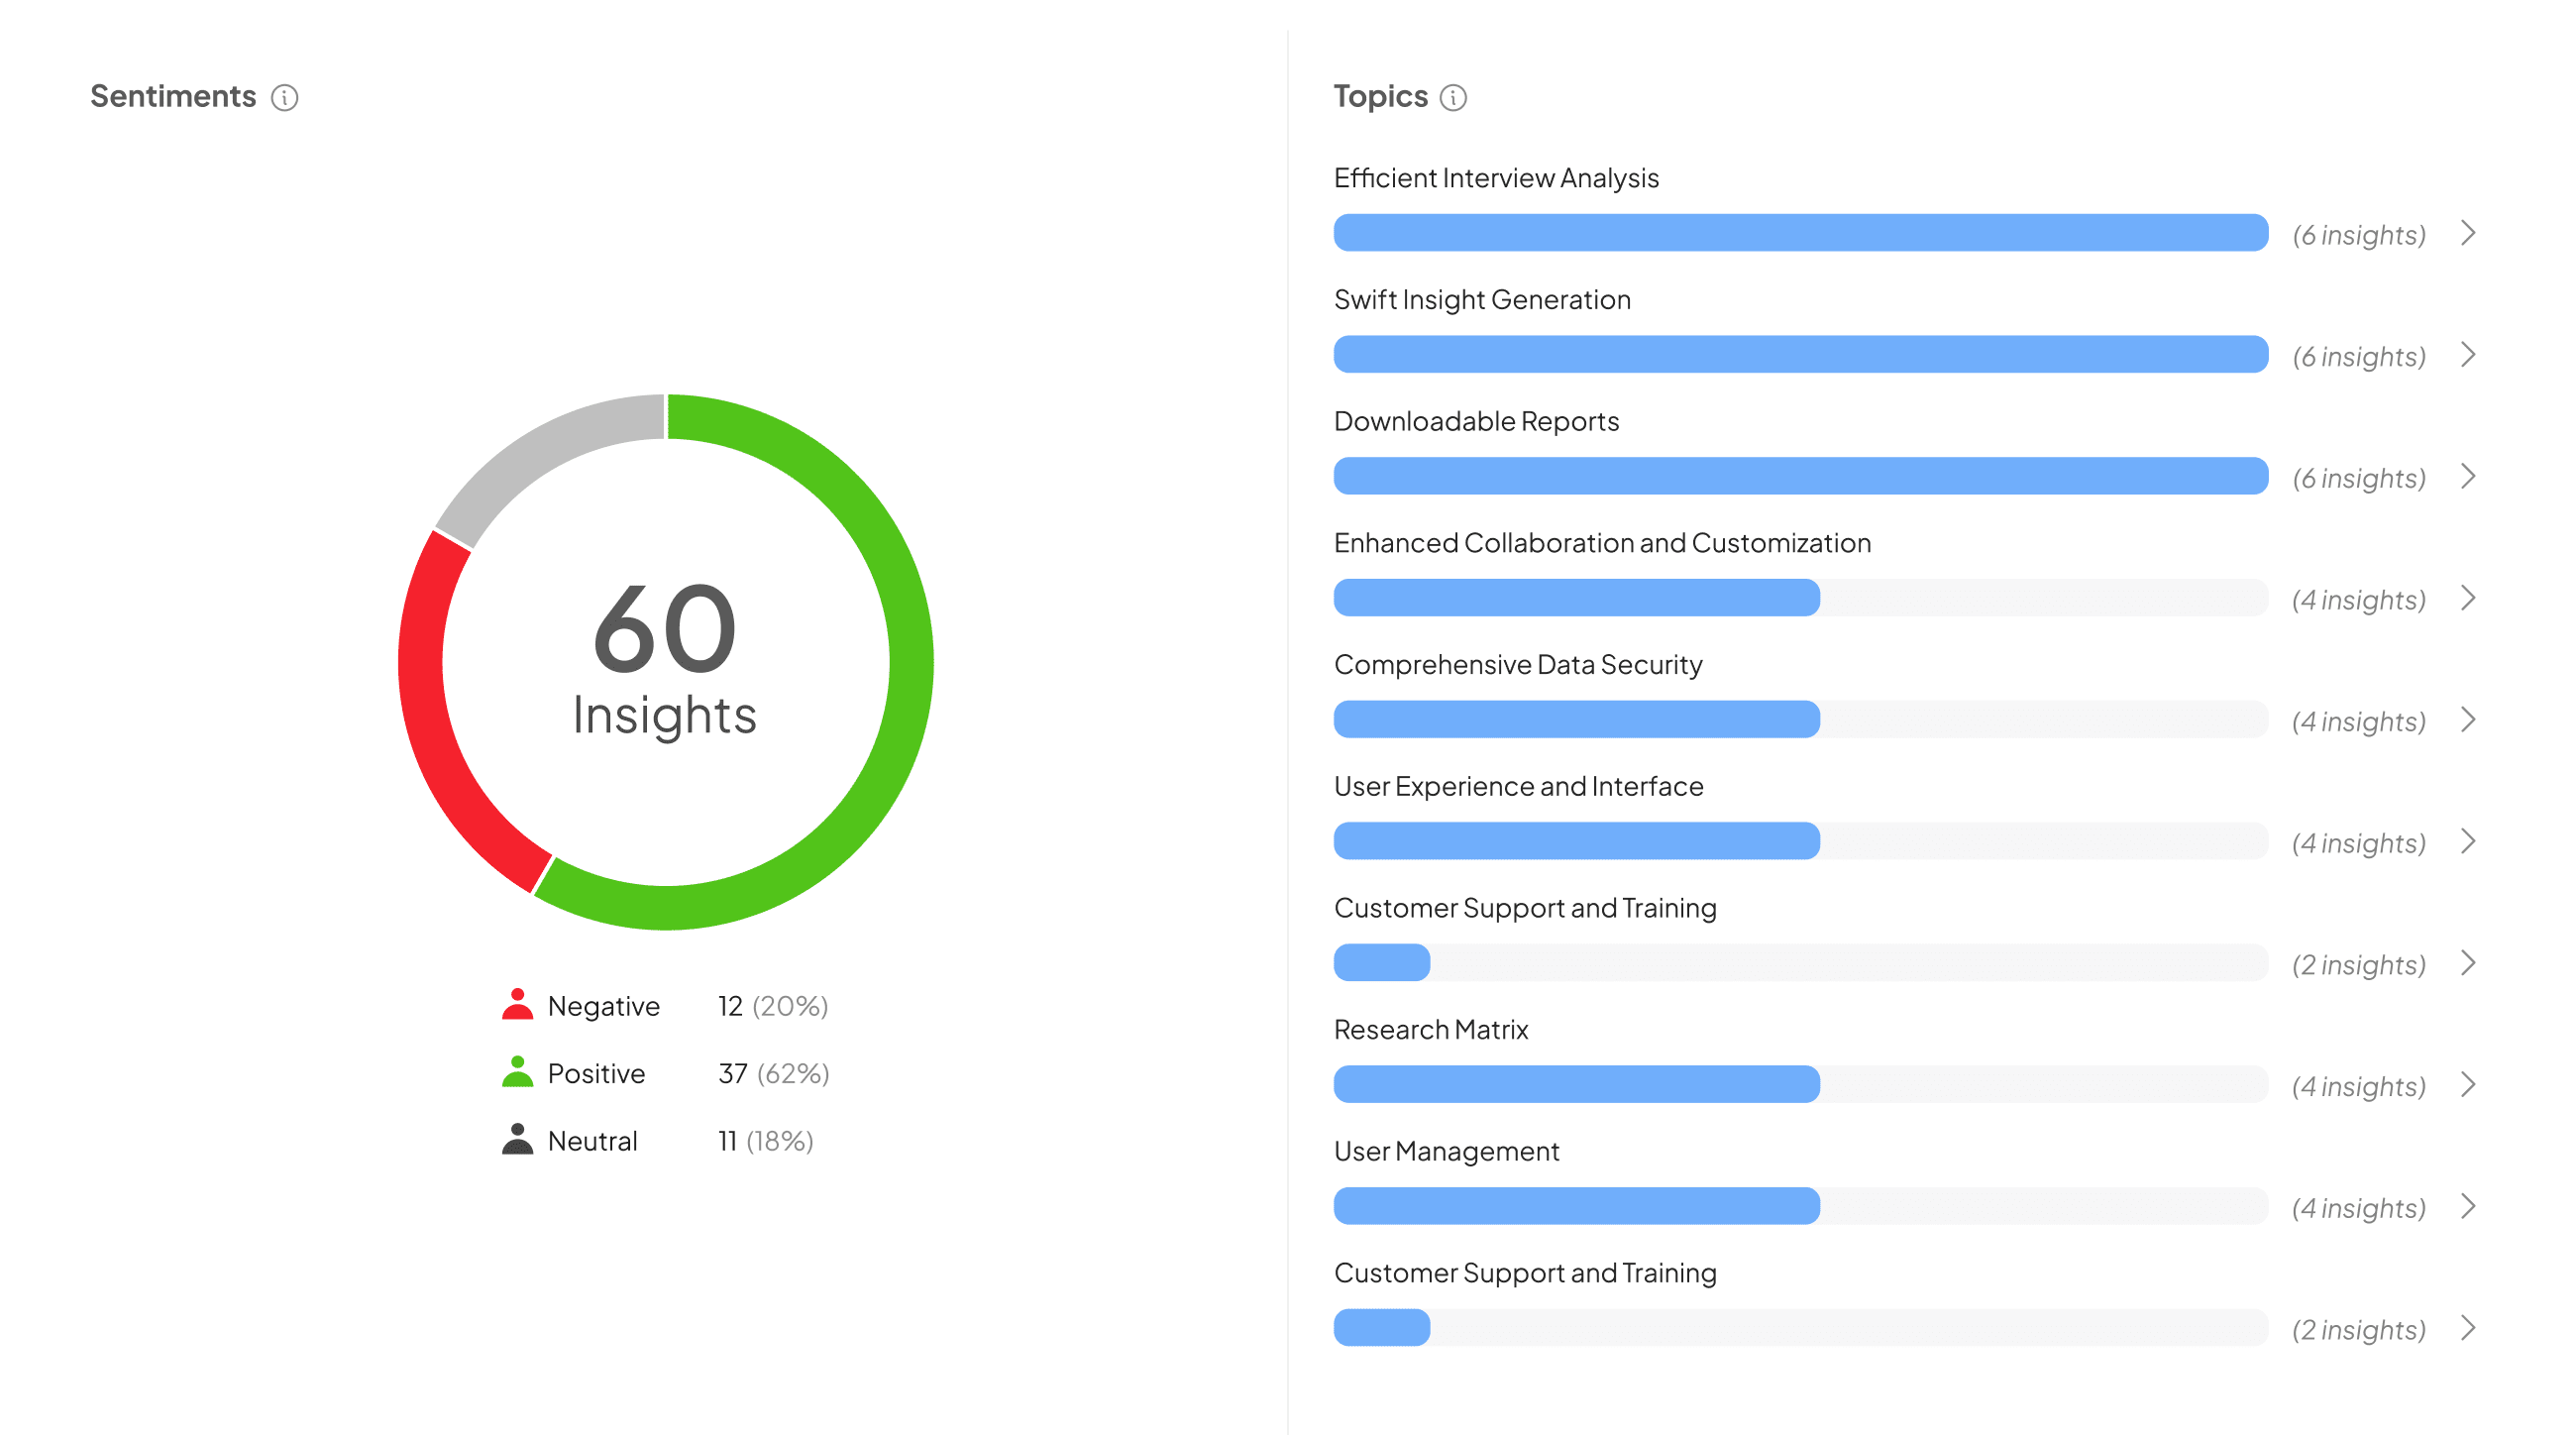
Data visualization plays an integral role in today’s data-driven environment. It simplifies complex information, making it accessible and engaging for diverse audiences. By transforming raw data into visual formats such as charts, graphs, and maps, businesses can convey messages more effectively and facilitate better decision-making. This process not only highlights trends but also uncovers insights that might be missed in traditional data presentations.
Incorporating free visualization tools enhances this capability, allowing individuals and organizations, regardless of budget, to create impactful visual representations. These tools empower users to explore their data interactively and share compelling stories based on evidence. As organizations increasingly rely on data to guide strategies, mastering these free visualization tools has become essential for clear communication and informed choices in a competitive marketplace.
Top Free Visualization Tools for Beginners
For beginners diving into data visualization, exploring the top free visualization tools can be invaluable. These tools not only simplify the process of creating compelling visuals but also cater to users with varying skill levels. Understanding these tools is essential for transforming data into insightful stories that can guide decision-making.
Several excellent free visualization tools include Tableau Public, Google Data Studio, and Plotly. Tableau Public offers an intuitive drag-and-drop interface, making it accessible for novices. Google Data Studio seamlessly integrates with other Google products, allowing users to create dynamic reports. Plotly stands out with its advanced customization options, enabling detailed visualizations for users looking to explore deeper insights. Each of these options equips beginners to effectively translate their data into visually engaging formats, providing a solid foundation for further exploration in data visualization.
Free Visualization Tools for Simple Data Sets
Free visualization tools offer an accessible way for individuals and businesses to present simple data sets effectively. These tools enable users to create engaging visualizations without requiring extensive programming skills or a large budget. For instance, platforms like Google Charts and Datawrapper allow easy data entry to generate various chart types, enhancing audience comprehension of critical information.
To maximize their potential, it’s essential to explore some of the top free options available. First, Google Charts stands out for its versatility and integration with other Google services. Next, Canva's chart maker provides an intuitive interface, making design simple and visually appealing. Lastly, Visme enables users to create infographics that present data in a storytelling format. Each tool not only simplifies the visualization process but also empowers users to communicate their insights effectively, fostering informed decision-making.
Advanced Features in Free Tools
Advanced visualization tools offer a range of features that enhance the user experience and data representation. These tools often provide templates and customizable options to tailor visuals to specific needs. With drag-and-drop interfaces, users can create complex charts and dashboards without requiring advanced technical skills or coding expertise. This democratization makes data visualization accessible to everyone in a business, fostering a collaborative environment where insights can be easily shared and understood.
Another notable feature is the integration capability with various data sources. Users can easily connect these tools to spreadsheets, databases, and APIs, allowing real-time data updates for more accurate and timely insights. Additionally, many free visualization tools offer advanced analytics features, such as predictive modeling and trend analysis, that empower users to uncover actionable insights. These advanced functionalities ensure that free visualization tools meet the growing demands for sophisticated data analysis in an increasingly data-driven world.
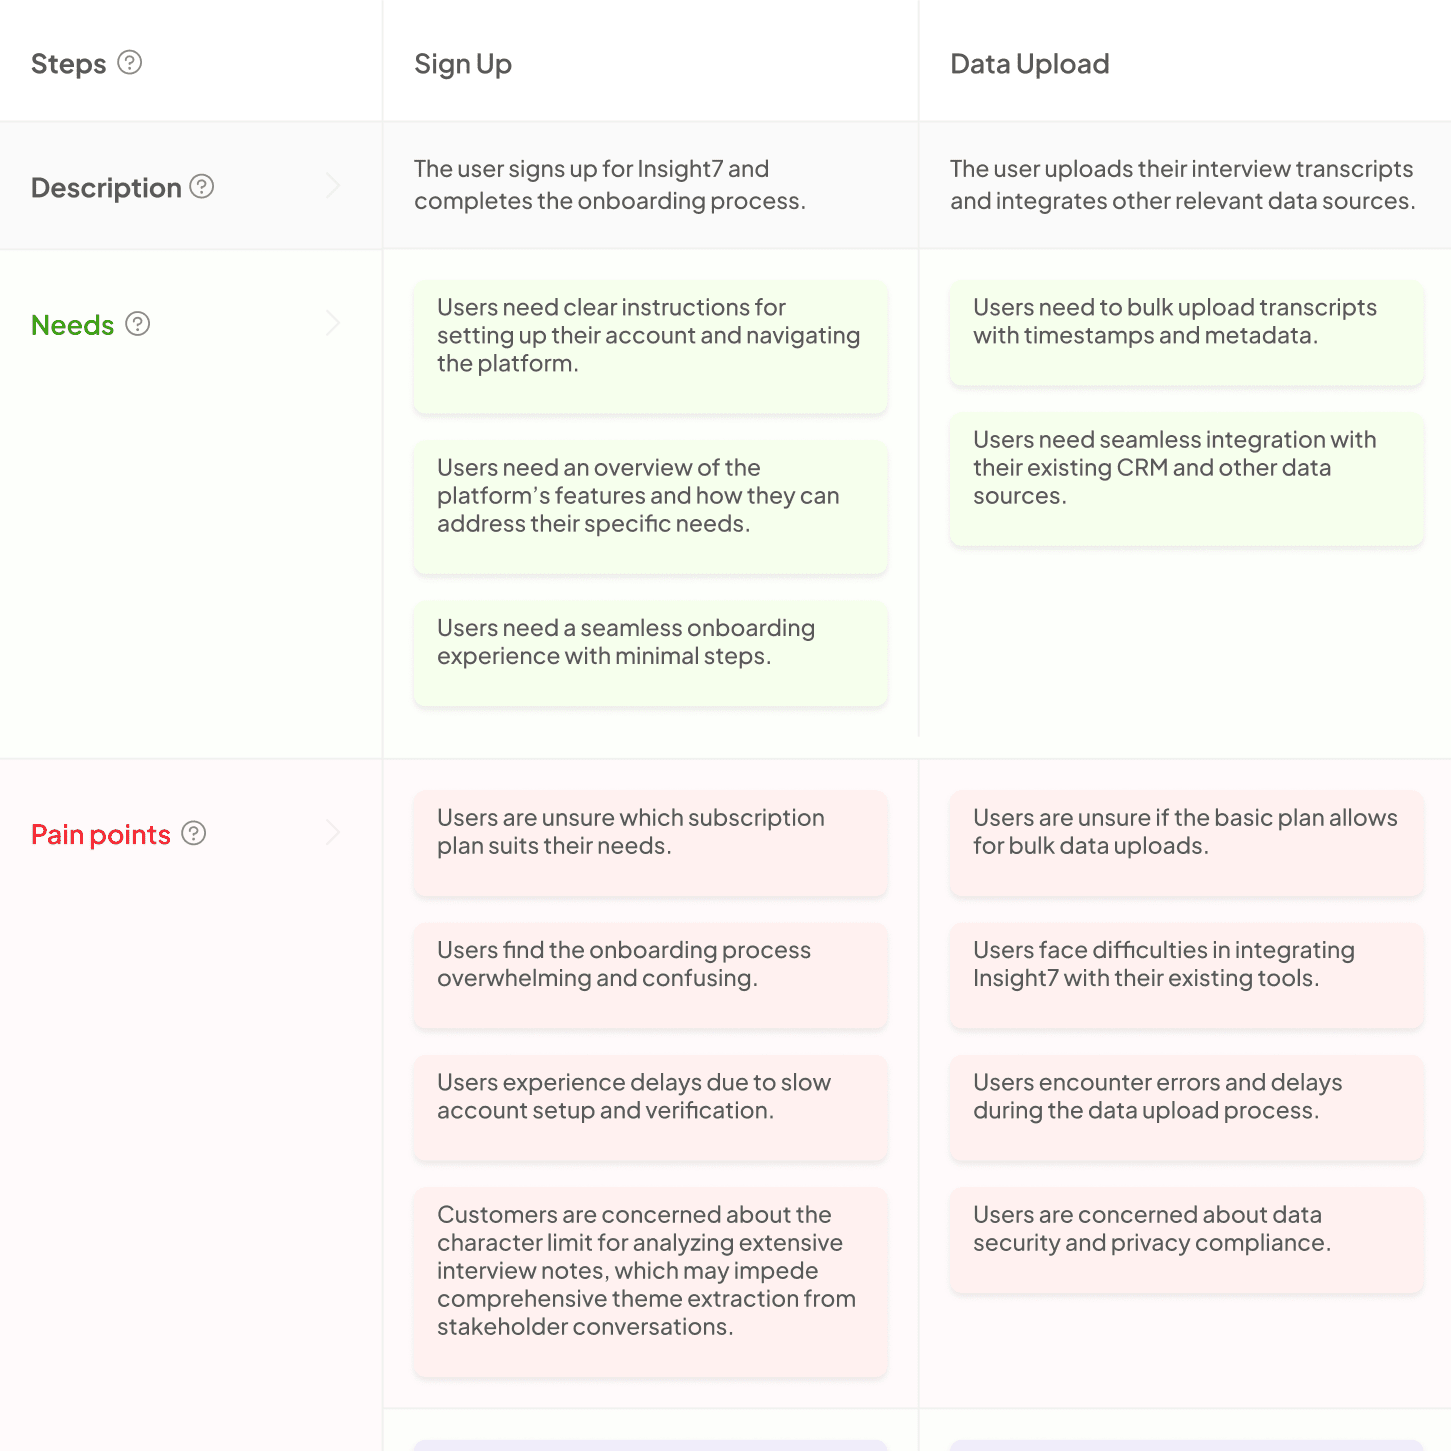
Comparing Features and Usability of Free Visualization Tools
When comparing features and usability of free visualization tools, it’s essential to focus on user experience and functionality. Popular options offer a variety of chart types, customizable interfaces, and data connectivity that cater to diverse needs. Tools like Tableau Public and Google Data Studio allow users to create visually appealing displays with ease, accommodating both novices and experienced users alike.
To effectively evaluate these free visualization tools, consider the following criteria:
- Ease of Use: Analyze how intuitive the tool’s interface is for new users.
- Customization Options: Assess the variety of templates and customization capabilities available.
- Integration: Look into how easily the tool can connect with other data sources.
- Collaboration Features: Check if the tool supports sharing and collaboration among users.
- Security: Evaluate the level of data security provided by the tool.
Understanding these features allows users to select the best free visualization tools suited to their specific requirements, enhancing their data presentation and storytelling capabilities.
Feature Set: What Do Free Visualization Tools Offer?
Free visualization tools offer a variety of features designed to help users easily create compelling visuals from their data. First, these tools typically provide a range of chart types, such as bar, line, and pie charts, allowing users to present data in different ways. Moreover, many tools offer drag-and-drop functionality, which simplifies the design process and helps non-technical users produce professional-looking graphics.
Another important feature is data connectivity. Many free tools can ingest data from various sources, such as spreadsheets and databases, enabling seamless updates for real-time analysis. Additionally, customization options empower users to modify colors, labels, and layouts, ensuring their visuals align with branding needs. Finally, sharing capabilities are crucial; most platforms allow users to export their visuals or share them directly on social media or websites, fostering easier communication of insights. Through these features, free visualization tools serve as accessible resources for effective data storytelling.
User Experience: Navigating Free Visualization Tools
Navigating free visualization tools can be a straightforward and rewarding experience. Understanding the user interface is essential, as most free visualization tools prioritize accessibility for users at all skill levels. Many platforms allow anyone in a business to jump right into their features without requiring extensive training or expertise. This democratization of data visualization encourages wider participation and idea sharing.
When using free visualization tools, you can quickly create reports, visualize customer experiences, and pinpoint areas for improvement. It's beneficial to explore the various workflows available, as these help streamline your tasks and enhance productivity. By mastering these tools, you not only simplify your workflow but also gain insights that drive your decision-making processes. Whether you’re a beginner or seasoned visualizer, embracing these accessible options can greatly enhance your data storytelling capabilities.
Pros and Cons of Using Free Visualization Tools
Free Visualization Tools offer a balanced mix of benefits and drawbacks for users. On the positive side, these tools are often user-friendly and easy to access, making them suitable for individuals or businesses with limited budgets. They provide essential features and capabilities sufficient for basic visualization needs. Additionally, the vast selection available allows users to choose tools that best fit their specific requirements without incurring costs.
However, there are drawbacks associated with free visualization tools. Limited functionalities compared to paid versions can hinder more complex projects. Users may also struggle with customer support or experience less frequent updates, affecting the tools' reliability over time. Additionally, concerns over data privacy may arise when using free platforms, as users might not fully understand how their data is handled. Weighing these pros and cons is essential for deciding whether to adopt free visualization tools for your data visualization needs.
Advantages of Free Visualization Tools for Personal and Professional Use
Free visualization tools offer significant advantages for both personal and professional applications. One of the primary benefits is accessibility. Individuals or small businesses often have limited budgets; these tools provide powerful data visualization capabilities without financial strain. Users can create compelling charts, graphs, or dashboards that make data more understandable and visually appealing.
Moreover, free visualization tools often come with user-friendly interfaces. This allows even those without extensive technical skills to design and share visuals easily. Whether one is preparing a presentation or analyzing personal projects, these tools make the process straightforward. Additionally, many free options boast community support and a wealth of online tutorials. This enables users to enhance their data storytelling skills progressively. Overall, free visualization tools serve as essential resources, making data insights available to everyone, regardless of their experience level.
Limitations: What Do You Sacrifice with Free Tools?
When exploring free visualization tools, it’s important to recognize the limitations that often come with them. One of the primary sacrifices is the lack of advanced features. While these tools may be effective for basic data representation, they often fall short on customizable options and in-depth analytics. This can hinder the flexibility needed to create truly insightful visualizations.
Another drawback is the potential for data restrictions. Many free tools impose limitations on the amount of data you can upload or manipulate, which might not support larger projects. Additionally, these tools may offer limited support and resources, which can leave users without guidance when they encounter issues. Security is also a concern, as free platforms may not provide the same level of data protection as paid options. Evaluating these limitations can help users make informed decisions about their data visualization needs.
Conclusion: Choosing the Right Free Visualization Tool for Your Needs
Selecting the right free visualization tools requires a clear understanding of your specific needs. Different tools offer various features tailored for distinct purposes—whether you’re interested in creating dynamic dashboards, detailed reports, or simple charts. Consider what type of data you will be working with and the level of complexity you require in your visualizations.
Moreover, it’s essential to evaluate ease of use and support resources available within each tool. Test a few options in alignment with your data sets to see which platform feels most intuitive. Ultimately, the perfect choice matches your goals with the capabilities of the free visualization tools you explore, ensuring that your data insights are presented in the most effective manner.