
In today's data-driven business world, Analytics Mastery Tools have become indispensable for extracting valuable insights from vast amounts of information. These sophisticated platforms empower professionals to uncover hidden patterns, trends, and correlations within complex datasets, driving informed decision-making across industries.
For business intelligence analysts and data professionals, the right analytics tool can be a game-changer. It streamlines the process of analyzing large-scale data, including interview transcripts and customer feedback, with unprecedented ease and efficiency. By abstracting complex functionalities behind user-friendly interfaces, these tools democratize data analysis, allowing both seasoned researchers and novice users to harness the power of advanced analytics techniques without extensive technical expertise.
Understanding the Importance of Data Analytics
In today's data-driven business environment, mastering analytics tools is crucial for success. These powerful instruments enable professionals to extract valuable insights from vast amounts of information, driving informed decision-making and strategic planning. By harnessing the capabilities of advanced analytics platforms, businesses can uncover hidden patterns, predict future trends, and optimize their operations for maximum efficiency.
One key aspect of analytics mastery is understanding the diverse range of tools available and their specific applications. From data visualization software to machine learning algorithms, each tool serves a unique purpose in the analytics ecosystem. For instance, interactive dashboards allow for real-time monitoring of key performance indicators, while predictive modeling techniques help forecast future outcomes based on historical data. By developing proficiency in these various tools, analysts can tackle complex business challenges and provide actionable recommendations to drive growth and innovation.
Evolution of Data Analytics: From Spreadsheets to AI
The evolution of data analytics has been nothing short of revolutionary. From the days of manual spreadsheets to today's AI-powered solutions, the journey has been marked by significant leaps in efficiency and insight generation. Modern analytics mastery tools have transformed how businesses interpret and utilize their data, offering unprecedented speed and accuracy.
At the forefront of this transformation are AI-driven platforms that can process vast amounts of information in seconds. These advanced systems go beyond simple data aggregation, providing intelligent insights and even creating personas from complex datasets. For analysts and business intelligence professionals, this means less time spent on data manipulation and more time dedicated to strategic decision-making. The shift from traditional methods to AI-enhanced analytics represents a paradigm change in how organizations approach data-driven problem-solving and market research.
Key Analytics Mastery Tools for Data Professionals
In the realm of data analytics, mastering the right tools is crucial for success. Analytics mastery tools have revolutionized how professionals extract insights from vast datasets. These powerful platforms offer intuitive interfaces for visualizing key ideas, making complex data more accessible and actionable.
One standout feature of modern analytics tools is their ability to generate comprehensive reports from minimal input. With just a handful of conversations or data points, analysts can now produce well-labeled, framed insights that drive decision-making. These tools go beyond basic analysis, offering capabilities like automatic PowerPoint presentation creation, streamlining the process of sharing findings with stakeholders. Additionally, advanced querying functions allow users to summarize entire datasets, identify top pain points, create buyer personas, and recommend solutions, all through simple prompts. This level of functionality empowers data professionals to unlock deeper insights and deliver more value to their organizations.
Essential Software for Data Analysts
In the realm of data analysis, having the right tools at your disposal is crucial for success. Analytics mastery tools have become indispensable for professionals seeking to extract meaningful insights from vast datasets. For business intelligence and data analysts, these software solutions streamline workflows, enhance productivity, and unlock deeper understanding of complex information.
Two essential tools stand out in the analytics landscape:
-
Data Visualization Software: Programs like Tableau and Power BI transform raw data into visually compelling charts, graphs, and dashboards. These tools enable analysts to present complex findings in an easily digestible format, facilitating better decision-making across organizations.
-
Statistical Analysis Packages: Software such as R and SPSS provide robust capabilities for advanced statistical modeling and hypothesis testing. These tools empower analysts to uncover hidden patterns, trends, and correlations within datasets, leading to more accurate predictions and insights.
By mastering these analytics tools, data professionals can elevate their skills, streamline their workflows, and deliver more impactful results to stakeholders.
Advanced Excel Techniques for Business Intelligence Analysts
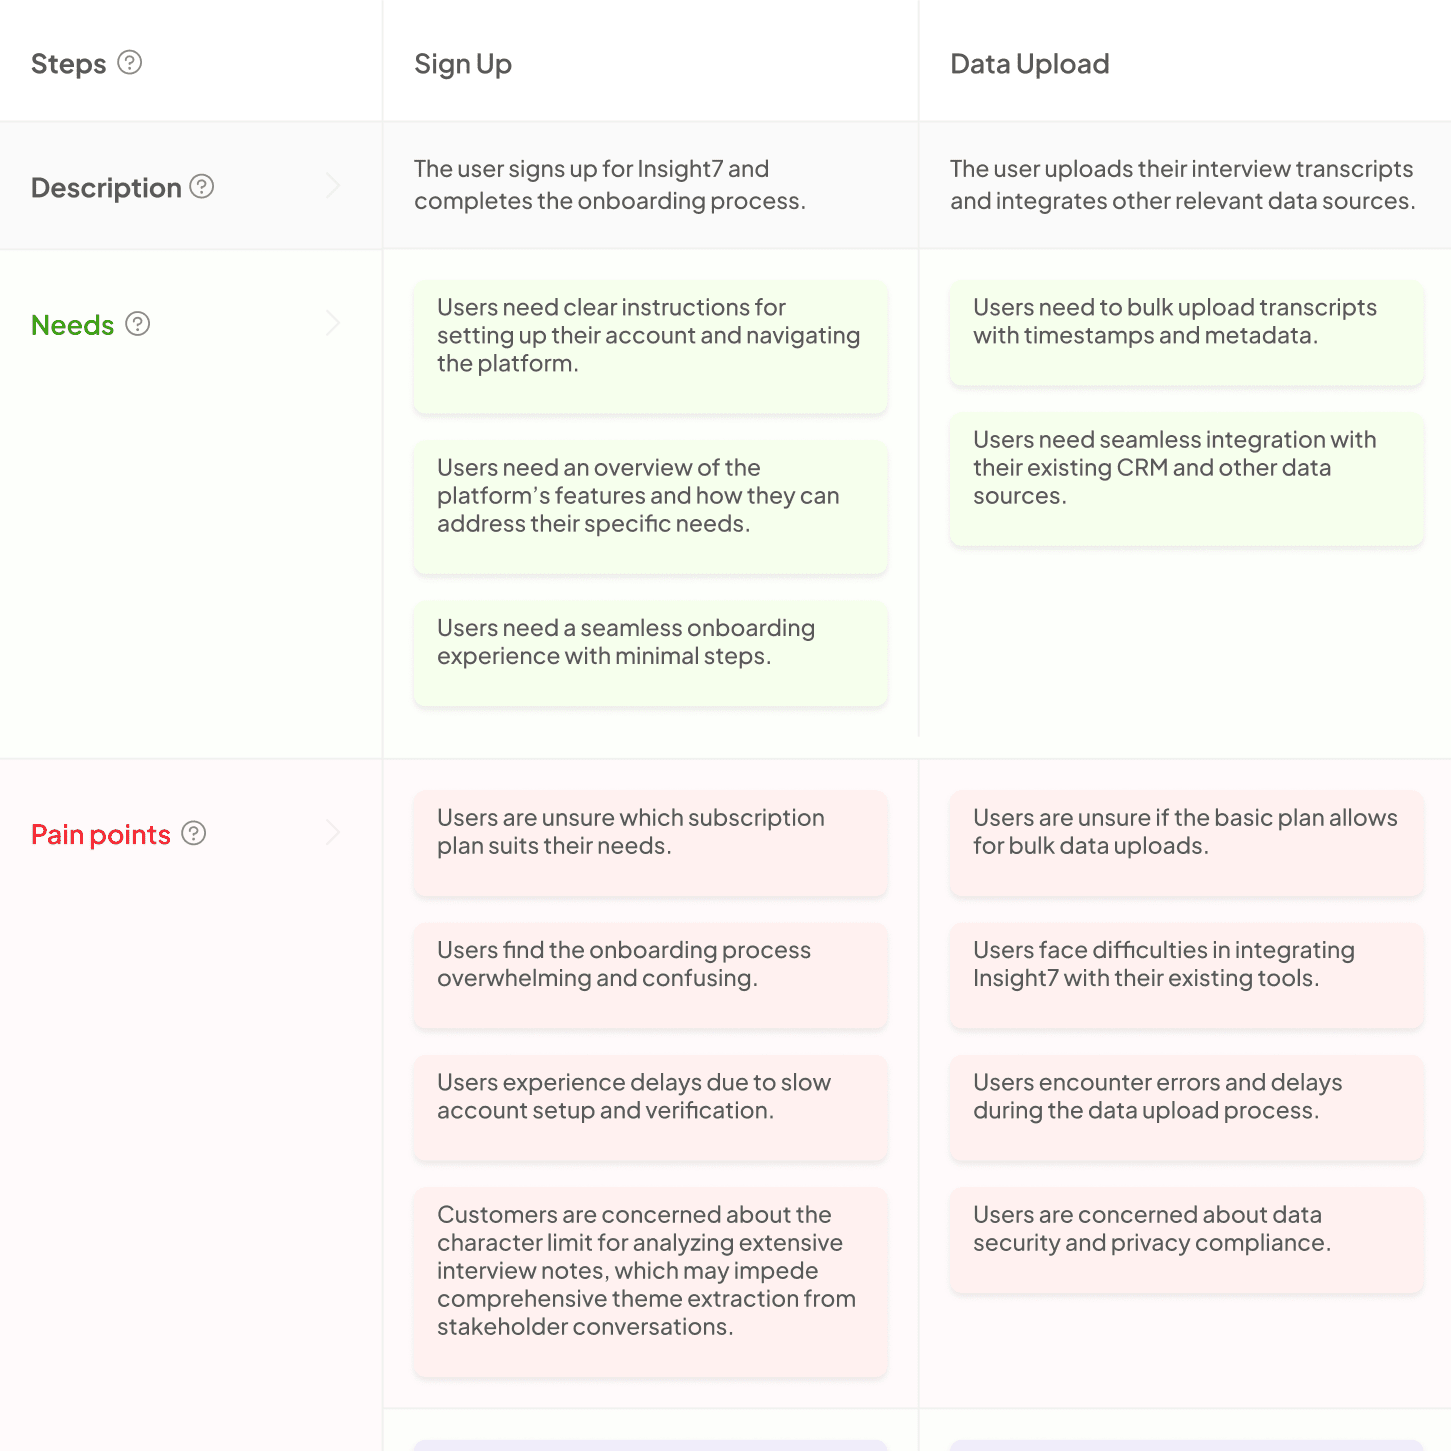
Excel, a cornerstone of data analysis, offers powerful features for Business Intelligence Analysts to manipulate and visualize complex datasets. The matrix technique, reminiscent of traditional spreadsheets, allows for efficient organization of interview data or participant responses. This method arranges participants on the left, questions at the top, and insights within cells, creating a comprehensive overview of collected information.
Advanced Excel techniques can significantly enhance data processing speed and accuracy. For instance, pivot tables enable quick summarization of large datasets, while conditional formatting helps identify trends and patterns visually. Power Query, an Excel add-in, streamlines data cleaning and transformation processes. These tools, combined with Excel's robust formula capabilities, empower analysts to extract meaningful insights and make data-driven decisions swiftly and effectively.
Leveraging SQL for Robust Data Analysis
SQL stands as a cornerstone in the toolkit of data analysts seeking to master their craft. This powerful query language enables professionals to extract, manipulate, and analyze vast datasets with precision and efficiency. By harnessing SQL's capabilities, analysts can uncover hidden patterns, trends, and insights that drive informed business decisions.
For those aiming to achieve analytics mastery, SQL offers a robust foundation for data exploration and interpretation. Its versatility allows for complex joins across multiple tables, intricate filtering mechanisms, and aggregation functions that distill large volumes of information into meaningful summaries. Moreover, SQL's widespread adoption in the industry ensures compatibility with various database systems and analytics platforms, making it an indispensable skill for professionals navigating the data-driven landscape of modern business intelligence.
Modern Data Visualization Tools
In the realm of data analytics, visualization tools have revolutionized how insights are presented and understood. Modern platforms now offer sophisticated ways to represent complex data sets, making it easier for analysts to extract meaningful patterns and trends. These advanced tools go beyond simple charts and graphs, providing interactive and dynamic visualizations that can adapt to user inputs in real-time.
One of the most impressive features of contemporary data visualization tools is their ability to automatically generate visual representations from raw data. This capability significantly reduces the time and effort required for manual data processing and charting. Additionally, these tools often incorporate AI-driven algorithms that can identify key insights and highlight them visually, guiding analysts towards the most relevant information. By streamlining the visualization process, these tools enable professionals to focus more on interpreting results and developing actionable strategies, ultimately enhancing the overall efficiency of data-driven decision-making.
Mastering Tableau for Customer Insight Analysis
Tableau stands out as a powerful tool for customer insight analysis, offering a visual approach to data interpretation. By mastering Tableau, analysts can transform raw customer data into compelling stories that drive business decisions. The software's intuitive interface allows for the creation of interactive dashboards, making complex data accessible to stakeholders across the organization.
One of Tableau's key strengths lies in its ability to connect disparate data sources, providing a holistic view of customer behavior. Analysts can easily blend data from CRM systems, social media platforms, and transactional databases to uncover hidden patterns and trends. This comprehensive approach enables businesses to develop more targeted marketing strategies and improve customer experiences. Moreover, Tableau's real-time data processing capabilities ensure that insights remain current, allowing for agile decision-making in today's fast-paced business environment.
Power BI Techniques for Business Analysts
Power BI offers a robust suite of tools for business analysts to transform raw data into actionable insights. By mastering these techniques, analysts can create compelling visualizations and interactive dashboards that drive decision-making. One key feature is the ability to connect to multiple data sources, allowing for comprehensive analysis across various platforms.
Data modeling in Power BI enables analysts to establish relationships between different datasets, creating a unified view of business operations. Advanced DAX formulas provide the means to perform complex calculations and create custom metrics tailored to specific business needs. Additionally, Power BI's natural language query feature empowers users to ask questions about their data in plain English, making analytics more accessible to non-technical stakeholders. These capabilities, combined with Power BI's cloud-based sharing options, make it an essential tool for modern business intelligence professionals seeking to enhance their analytics mastery.
Advanced Techniques for Data Analytics Success
In the realm of data analytics, mastering advanced techniques is crucial for extracting meaningful insights. One powerful approach is creating comprehensive datasets that enable AI-driven personas to interact with the information. These virtual personas can ask questions, summarize findings, and provide unique perspectives on the data.
For business intelligence analysts seeking to elevate their analytics mastery, multi-product search queries offer a game-changing capability. This technique allows for simultaneous exploration across multiple datasets, uncovering hidden connections and trends. Additionally, visual experiences like journey maps transform raw data into actionable insights. By generating draft process maps and recommendations based on existing data, analysts can quickly identify areas for improvement in various sectors, such as banking. These advanced tools empower analysts to deliver more value to their clients and drive data-informed decision-making across industries.
Predictive Analytics Mastery Tools
Predictive analytics mastery tools have revolutionized the way businesses harness data for strategic decision-making. These advanced platforms empower analysts to extract valuable insights from complex datasets, enabling more accurate forecasting and trend identification. By integrating machine learning algorithms and statistical models, these tools can process vast amounts of information to uncover hidden patterns and correlations.
One key feature of analytics mastery tools is their ability to create comprehensive datasets from multiple sources. This functionality allows analysts to combine information from various projects or products, facilitating more holistic analyses. Additionally, these tools often include visual components, such as journey mapping capabilities, which can transform raw data into easily digestible visual representations. For instance, a banking analyst could generate a process map and recommendations based on existing customer data, providing a clear overview of potential improvements in service delivery.
Utilizing Machine Learning Algorithms
Machine learning algorithms are revolutionizing data analytics, offering powerful tools for extracting insights from complex datasets. These advanced techniques enable businesses to uncover hidden patterns, predict trends, and make data-driven decisions with unprecedented accuracy. By automating the process of analyzing large volumes of information, machine learning algorithms significantly enhance the efficiency and effectiveness of data analysis workflows.
One of the key advantages of utilizing machine learning in analytics is its ability to adapt and improve over time. As these algorithms process more data, they become increasingly proficient at identifying relevant patterns and generating actionable insights. This continuous learning process allows organizations to stay ahead of market trends and customer preferences, providing a competitive edge in today's data-driven business environment. Moreover, machine learning algorithms can handle diverse data types, including structured and unstructured data, making them versatile tools for comprehensive analytics across various industries and applications.
Building Predictive Models with Python
Python's versatility shines in predictive modeling, offering a robust toolkit for data analysts to forecast trends and outcomes. With libraries like scikit-learn, TensorFlow, and PyTorch, building sophisticated models becomes accessible even to those new to machine learning. These powerful tools enable analysts to tackle complex problems, from customer churn prediction to sales forecasting.
To embark on your predictive modeling journey with Python, consider these key steps:
- Data Preparation: Clean and preprocess your dataset using pandas and numpy.
- Feature Engineering: Create relevant features that capture important patterns in your data.
- Model Selection: Choose appropriate algorithms based on your problem type (e.g., regression, classification).
- Training and Evaluation: Split your data, train your model, and assess its performance using metrics like accuracy or RMSE.
- Fine-tuning: Optimize your model's hyperparameters using techniques like grid search or random search.
- Deployment: Integrate your model into production systems for real-time predictions.
By mastering these steps, you'll be well-equipped to harness Python's predictive modeling capabilities and drive data-driven decision-making in your organization.
Big Data Techniques for Large-Scale Analysis
In the realm of big data analytics, mastering advanced techniques is crucial for handling large-scale datasets effectively. As organizations grapple with ever-increasing volumes of information, analysts must employ sophisticated methods to extract meaningful insights. One key approach is distributed computing, which allows for the processing of massive datasets across multiple machines simultaneously. This technique significantly reduces computation time and enables the analysis of data that would be impossible to handle on a single system.
Another powerful tool in the big data arsenal is machine learning algorithms. These intelligent systems can automatically identify patterns and anomalies within vast datasets, uncovering hidden trends that might escape human observation. By combining machine learning with natural language processing, analysts can even extract valuable insights from unstructured text data, such as customer reviews or social media posts. Additionally, data visualization techniques play a vital role in making complex information accessible and actionable for decision-makers. Interactive dashboards and dynamic charts help translate raw data into compelling visual narratives, facilitating better understanding and more informed strategic choices.
Hadoop and Spark for Data Analysts
Hadoop and Spark have revolutionized the way data analysts handle large-scale data processing and analytics. These powerful tools, integral to the Analytics Mastery toolkit, offer unique capabilities for managing and analyzing vast amounts of information efficiently.
Hadoop, an open-source framework, excels at distributed storage and processing of big data across clusters of computers. It allows analysts to work with massive datasets that would be impractical to process on a single machine. Spark, on the other hand, is a fast and general-purpose cluster computing system that provides high-level APIs in Java, Scala, Python, and R. It's particularly well-suited for iterative algorithms in machine learning and data mining. Together, these tools enable data analysts to tackle complex analytical tasks, extract valuable insights, and drive data-informed decision-making in their organizations.
Stream Processing with Apache Kafka
Apache Kafka stands as a cornerstone in modern stream processing, offering robust capabilities for handling real-time data flows. This distributed event streaming platform excels in building high-performance data pipelines, enabling seamless integration of analytics applications. For business intelligence professionals seeking to master analytics tools, Kafka provides a scalable solution for processing large volumes of data with low latency.
At its core, Kafka operates on a publish-subscribe model, allowing multiple producers to send messages to topics while consumers read from these topics in parallel. This architecture facilitates the creation of fault-tolerant, highly available systems that can process millions of events per second. By implementing Kafka in your data analytics workflow, you can achieve near real-time insights, enabling faster decision-making and more agile business operations. As you explore various analytics mastery tools, consider how Kafka's stream processing capabilities can enhance your data-driven strategies and elevate your organization's analytical prowess.
Conclusion: Achieving Success with Analytics Mastery Tools
As we conclude our exploration of Analytics Mastery Tools, it's clear that these innovative solutions are revolutionizing the way businesses handle data. By simplifying complex processes and making advanced analytics accessible to users of all skill levels, these tools are democratizing data-driven decision-making across organizations.
The key takeaway is the emphasis on user-friendliness without sacrificing sophistication. Analytics Mastery Tools strike a balance between powerful capabilities and intuitive interfaces, allowing both seasoned researchers and newcomers to extract valuable insights from vast amounts of data. This approach not only enhances productivity but also fosters a data-centric culture within companies, ultimately leading to more informed strategies and improved business outcomes.