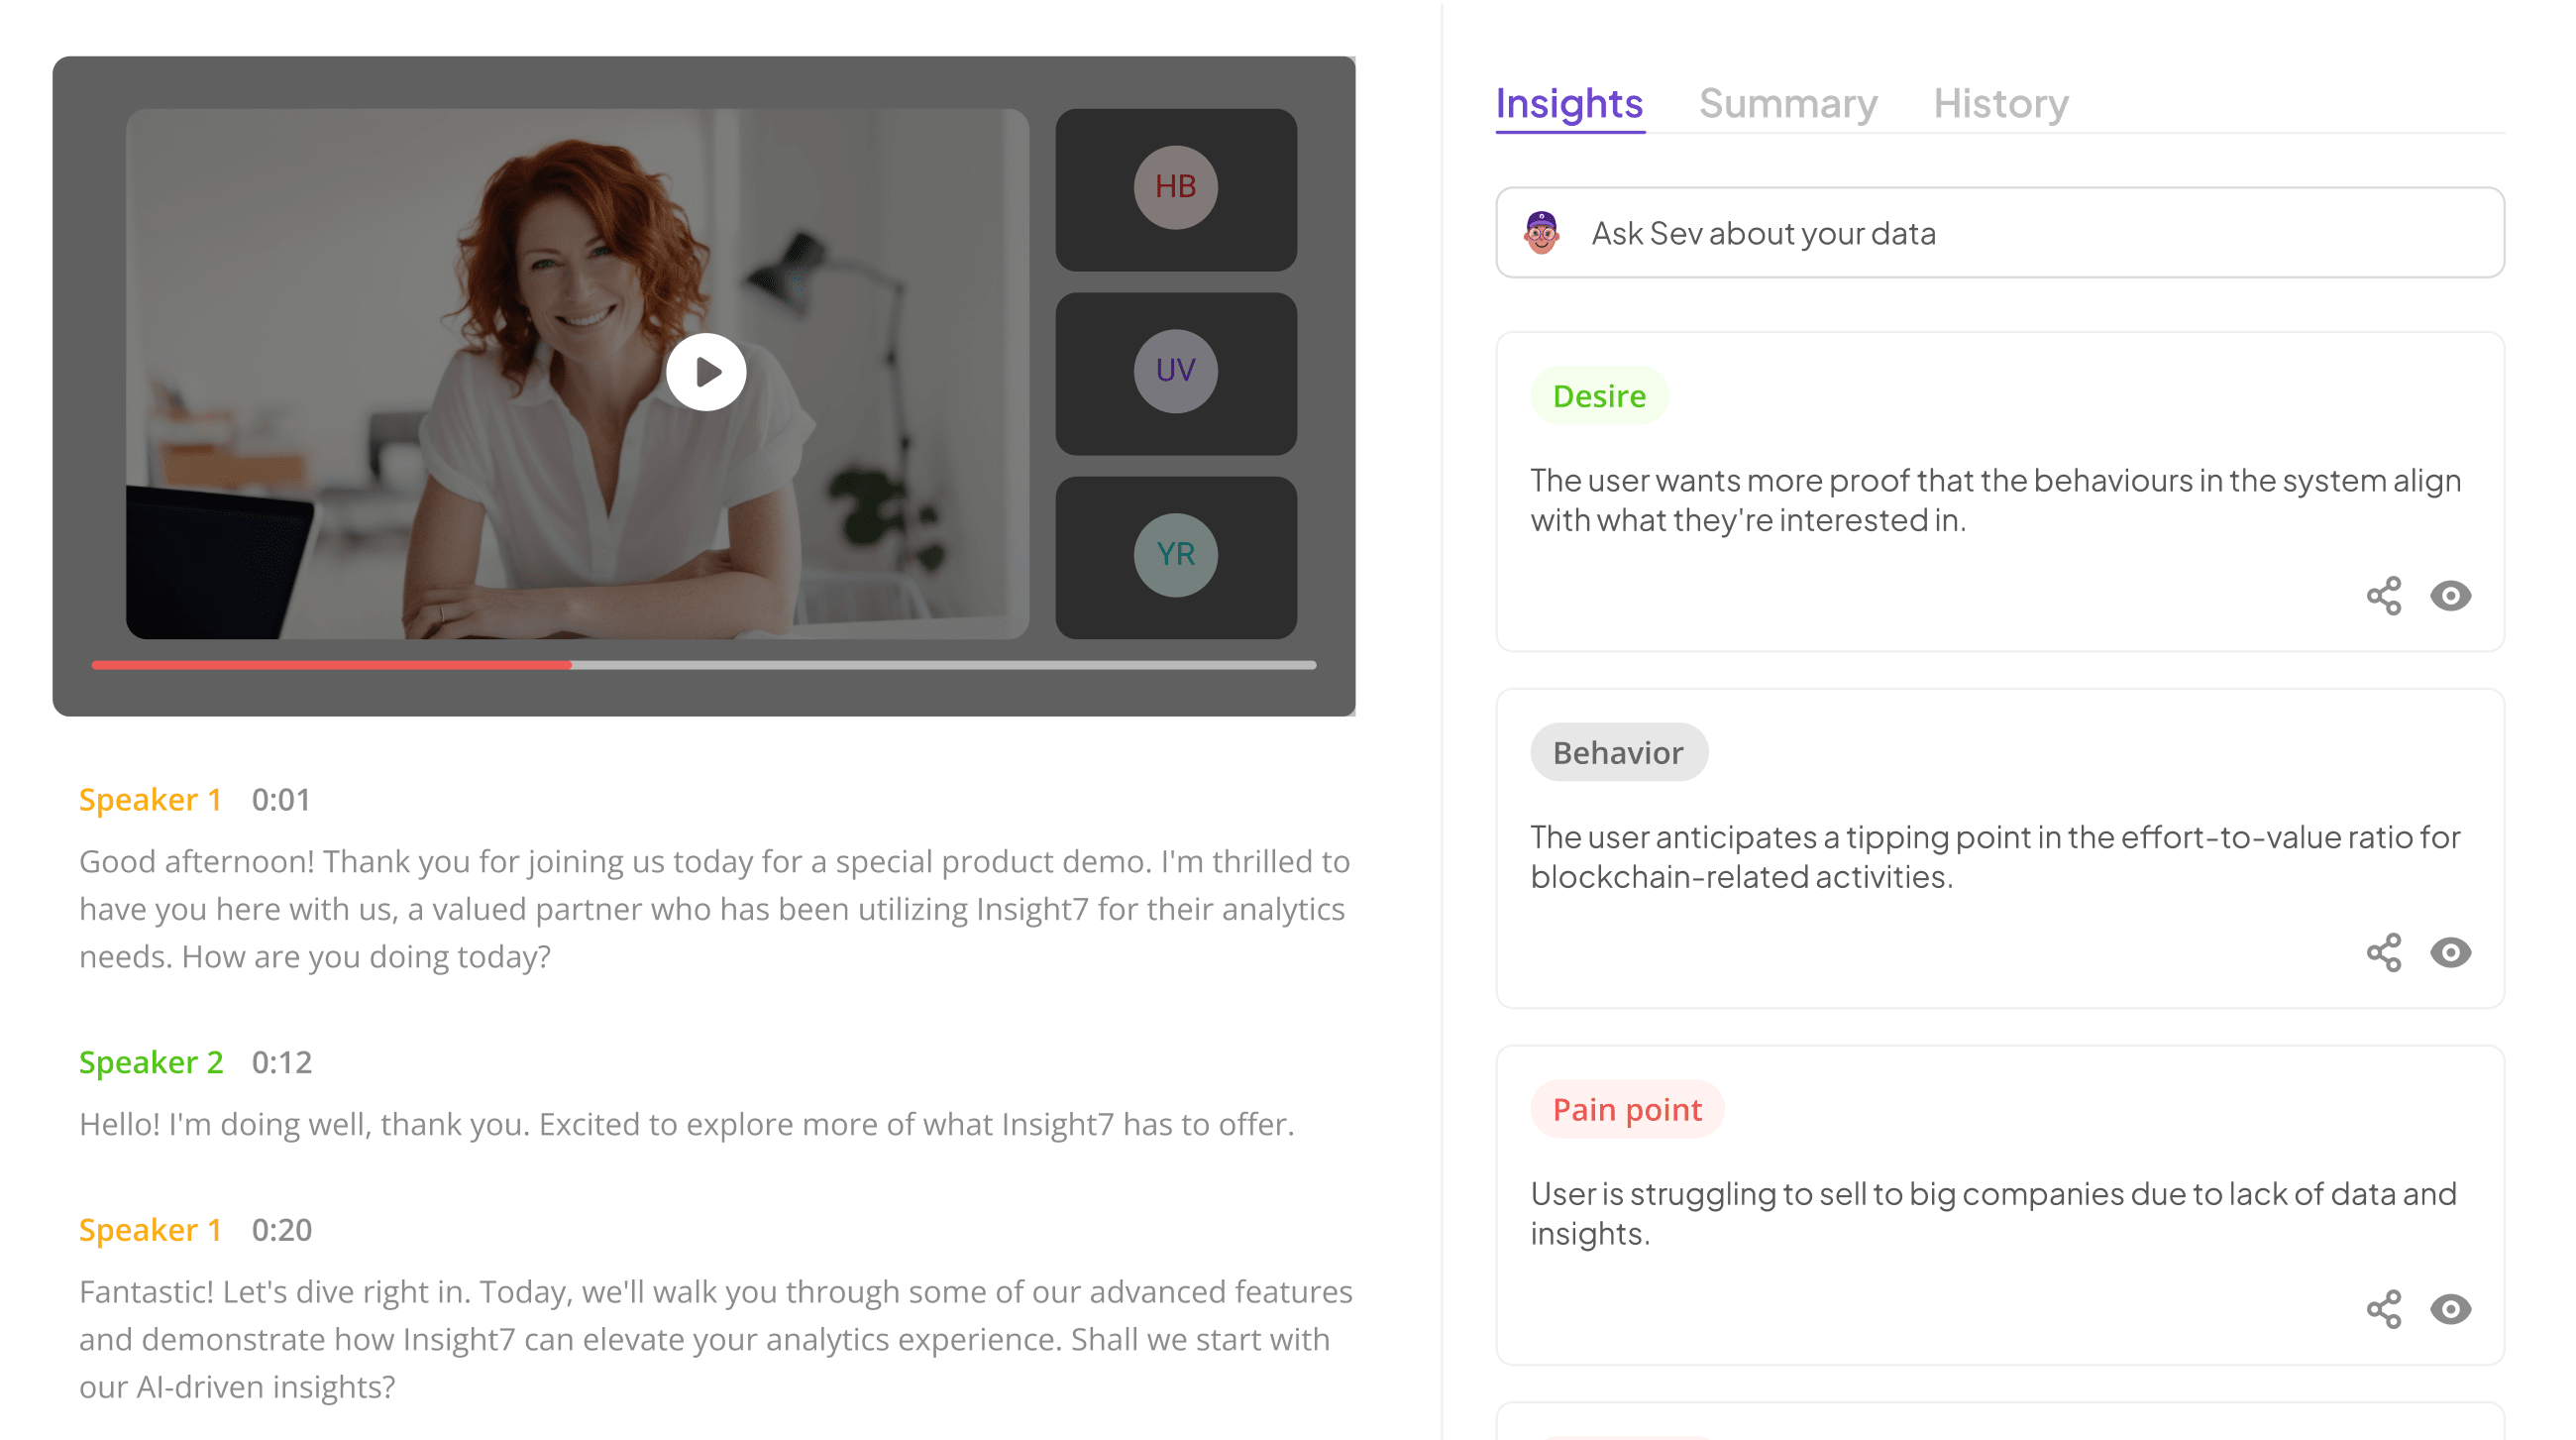
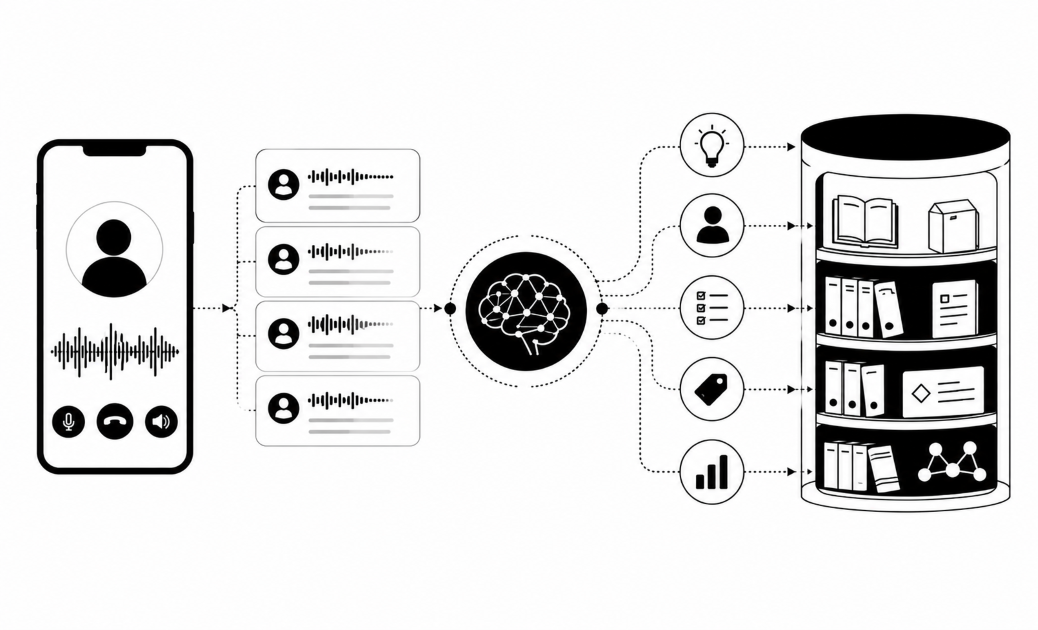
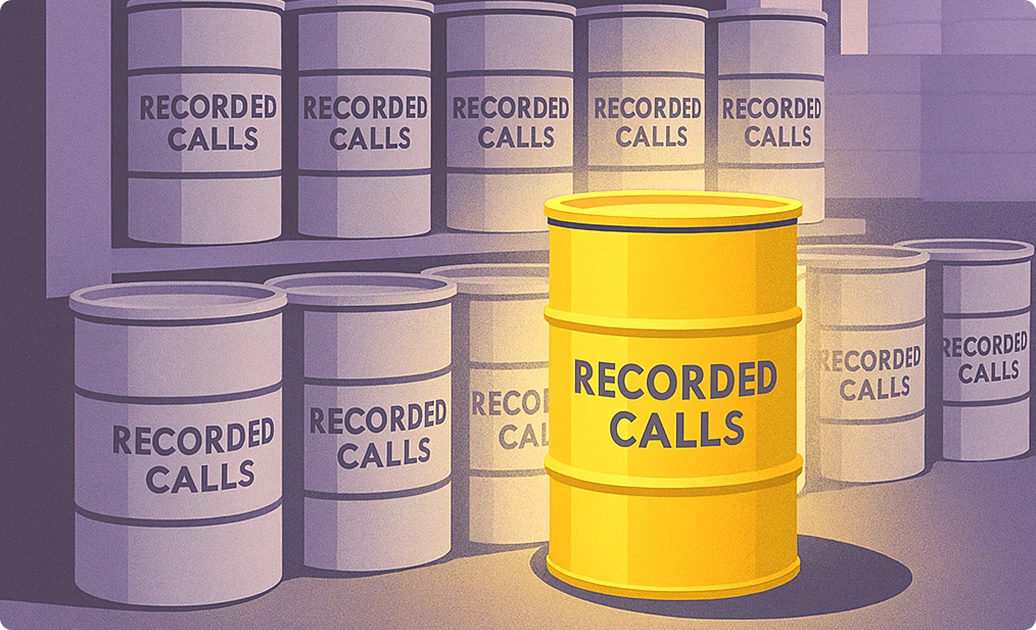
Essential QA Dashboards play a crucial role in enhancing the efficiency of Quality Assurance processes. In today's complex software landscape, effective decision-making relies on clarity and actionable insights. Quality Assurance managers are tasked with ensuring product excellence, navigating challenges while maintaining high standards. A well-structured dashboard provides a visual representation of key metrics, offering a comprehensive view of the QA process.
In this section, we will explore five essential dashboards that every QA manager should utilize. These dashboards not only facilitate seamless workflow but also empower teams to identify trends, track performance, and address issues proactively. By implementing these tools, QA teams can drive success and foster continuous improvement in their quality initiatives.
Analyze & Evaluate Calls. At Scale.


Understanding the Essential QA Dashboards Landscape
To understand essential QA dashboards, it is vital to recognize their function in enhancing testing efficiency and project visibility. These dashboards centralize data, providing insights that empower QA managers to monitor test progress and quality metrics. A comprehensive view allows for timely decision-making, improving overall software quality. This systematic approach not only identifies problem areas but also facilitates strong communication among teams.
Essential QA dashboards serve multiple purposes, including tracking bug resolution and evaluating performance benchmarks. They offer visual representations, making it easier to interpret data trends and manage testing processes effectively. By utilizing these dashboards, QA managers can ensure that their teams focus on critical tasks, minimize risks, and optimize testing strategies, ultimately leading to a higher quality product and user satisfaction.
Defining Essential QA Dashboards
Quality Assurance managers rely on Essential QA Dashboards to drive informed decision-making and streamline processes. These dashboards serve as visual representations of critical data, enabling teams to monitor progress, identify trends, and address potential issues. Understanding the key components that constitute essential dashboards is crucial for enhancing overall QA performance and efficiency.
First, it’s important to recognize the specific metrics that should be tracked on these dashboards. Key performance indicators (KPIs), such as defect rates, test coverage, and resolution times, provide insights that directly impact the quality of deliverables. Next, dashboards must be user-friendly, facilitating real-time access to data for team members at all levels. Finally, integrating these dashboards with continuous testing and deployment tools ensures accurate and timely updates. By defining these elements, QA managers can create dashboards that not only inform but also empower teams to achieve their quality goals effectively.
The Role of Dashboards in Quality Assurance
Dashboards play a crucial role in enhancing quality assurance by providing essential insights that guide decision-making. Through well-structured visualizations, QA teams can monitor vital metrics and performance indicators in real time. This immediate access to data allows teams to respond swiftly to quality challenges, ensuring that issues are identified and addressed before they escalate. Moreover, dashboards contribute to transparency in the QA process, enabling stakeholders to understand quality trends and performance benchmarks clearly.
Utilizing essential QA dashboards fosters a culture of continuous improvement. By analyzing data presented in these dashboards, managers can identify areas needing attention, adjust strategies, and measure the effectiveness of interventions. Furthermore, dashboards facilitate collaboration among team members, as shared insights promote collective problem-solving. In an environment where high-quality outcomes are paramount, dashboards prove to be invaluable tools for QA managers aiming to maintain standards and drive success.
Exploring the 5 Essential QA Dashboards
Quality Assurance (QA) teams thrive on data visualization, making essential QA dashboards indispensable tools for effective monitoring and decision-making. The exploration of these five dashboards unveils their unique capabilities in enhancing product quality and operational efficiency. Each dashboard offers valuable insights, enabling QA managers to identify trends, track performance, and streamline their processes.
The first essential QA dashboard is the Test Case Management Dashboard, which organizes and monitors test cases. It allows teams to ensure comprehensive test coverage. Next, the Bug Tracking and Resolution Dashboard provides a systematic way to capture reported bugs and monitor resolution times, crucial for maintaining product integrity. The Quality Trends and Analysis Dashboard offers in-depth insights into quality metrics and variations over time. Furthermore, the Performance Testing Dashboard focuses on monitoring system load and analyzing response times. Finally, the Automation Progress Dashboard tracks automation coverage and assesses the effectiveness of test frameworks. Together, these essential dashboards empower QA managers to make informed decisions that elevate the quality of their products.
Extract insights from interviews, calls, surveys and reviews for insights in minutes
1. Test Case Management Dashboard
The Test Case Management Dashboard is pivotal for any Quality Assurance (QA) manager seeking to enhance testing efficiency. This dashboard centralizes all test case information, offering a clear view of what has been executed, what remains, and the outcomes of each test. By utilizing this dashboard, QA teams can track progress quickly and identify areas requiring further attention or improvement.
Key components of the Test Case Management Dashboard include test case design, execution status, and result logging. It enables team members to collaborate effectively by providing easy access to information. Moreover, it helps in ensuring that all test cases are aligned with the specified requirements, contributing to higher product quality. By integrating this essential QA dashboard, QA managers can achieve improved productivity and more reliable deliverables that meet user expectations.
2. Bug Tracking and Resolution Dashboard
The Bug Tracking and Resolution Dashboard is crucial for any QA manager aiming to enhance quality assurance processes. This dashboard efficiently captures reported bugs, making it easy to track issues from identification to resolution. By organizing bug reports and categorizing them based on severity and type, teams can prioritize their efforts for optimal results, ensuring critical bugs are addressed swiftly.
Monitoring resolution times is another essential feature of this dashboard. It provides insights into how long it takes to rectify bugs, which allows QA managers to identify bottlenecks in their processes. By analyzing these metrics, teams can implement tactics to reduce resolution times and enhance overall efficiency. Consequently, the Bug Tracking and Resolution Dashboard becomes an indispensable tool within the arsenal of essential QA dashboards, transforming the way quality assurance teams operate and improving the software development lifecycle.
Step 1: Capturing Reported Bugs
A crucial first step in managing quality assurance is capturing reported bugs effectively. This process enhances your ability to maintain high-quality standards in your product. Begin by establishing a clear and systematic method for logging bugs. This includes defining specific criteria for what constitutes a bug, allowing team members to report issues uniformly. Documentation is key; ensure each reported bug includes pertinent details such as steps to reproduce, affected components, and severity levels.
Next, prioritize the captured bugs based on their impact on user experience and functionality. This helps ensure that critical issues are addressed promptly. Maintain transparency by regularly updating the status of reported bugs in the dashboard. This fosters collaboration and accountability among team members. By effectively capturing and prioritizing reported bugs, you provide a solid foundation for the subsequent steps in your QA process, ultimately contributing to the effectiveness of your Essential QA Dashboards.
Step 2: Monitoring Resolution Times
Monitoring resolution times is a critical aspect of quality assurance that helps ensure efficiency and effectiveness in addressing reported bugs. Utilizing dashboards designed for this purpose allows QA managers to visualize how long it takes to resolve issues from identification to resolution. This transparency enables teams to pinpoint bottlenecks and improve their processes over time, making it easier to meet deadlines and maintain product quality.
A successful monitoring approach consists of various elements. Firstly, track individual ticket resolution times to understand team performance and workflow. Secondly, analyze trends over specific periods to identify any recurring patterns, whether in high-volume resolutions or persistent delays. Lastly, establish benchmarks for resolution times based on historical data, enabling teams to set realistic goals and performance standards. By integrating these elements into Essential QA Dashboards, QA managers can drive continuous improvement and elevate team productivity.
3. Quality Trends and Analysis Dashboard
The Quality Trends and Analysis Dashboard serves as a crucial tool for QA managers seeking to enhance decision-making through data. By consolidating key performance metrics, this dashboard enables teams to identify patterns and trends over time. Visual representations of data assist in pinpointing areas requiring improvement and help in proactively addressing quality concerns.
Incorporating tools like insight7, Jira, and TestRail can enhance the effectiveness of the Quality Trends and Analysis Dashboard. These tools provide insights into common pain points and emerging trends, making it easier for teams to prioritize actions based on real data. Understanding the narrative behind the data is essential; it allows teams to translate raw metrics into actionable strategies that drive quality improvements. With this dashboard, QA managers can cultivate a culture of continuous improvement, ensuring that product quality aligns with customer expectations and organizational goals.
Tools for Quality Analysis
Effective tools for quality analysis are crucial in the realm of Quality Assurance, enabling QA managers to monitor and enhance the overall testing process. Essential QA dashboards function as centralized hubs where relevant data is visualized, making it easier to identify trends, monitor performance, and ensure compliance with established criteria. By leveraging these dashboards, QA managers can obtain real-time insights into their projects, enabling swift decision-making and increased efficiency.
The right tools for quality analysis include various software platforms that facilitate testing and bug tracking. These tools streamline processes such as test case management, bug capture, and resolution monitoring. Applications like insight7, Jira, TestRail, Azure DevOps, and Zephyr stand out as reliable options, providing essential features to assess software quality. Ultimately, by integrating these dashboards into their workflows, QA managers can significantly boost their team’s performance while maintaining high quality standards.
- insight7
To effectively utilize Essential QA Dashboards, QA managers must first recognize their significance in enhancing quality assurance practices. Each dashboard serves a vital role, providing insights and streamlining processes within a project. Essentially, they allow teams to visualize data trends, track progress, and identify areas needing improvement.
When employing these dashboards, one should focus on key aspects such as test case management, bug tracking, quality trends analysis, performance metrics, and automation coverage. For instance, a Test Case Management Dashboard organizes and monitors test cases effectively, ensuring coverage and identifying gaps. Meanwhile, a Bug Tracking and Resolution Dashboard captures reported issues and monitors resolution times, facilitating faster feedback loops. Ultimately, the insightful data drawn from these essential dashboards equips QA managers with the tools necessary for informed decision-making, improving collaboration and driving project success.
- Jira
Jira stands out as a crucial tool for Quality Assurance (QA) teams, providing an organized way to manage tasks, track bugs, and oversee project progress. Essential QA Dashboards within Jira empower managers to visualize key metrics and optimize workflows. By effectively setting up these dashboards, QA managers can quickly access the data they need, making it a pivotal part of any QA strategy.
One of the most beneficial aspects of using Jira is its customizable nature. Teams can tailor dashboards to display critical indicators, such as bug resolution times, test case statuses, and overall project health. By leveraging these dashboards, QA managers not only enhance team communication but also foster accountability and transparency, leading to a more effective quality assurance process. As this tool integrates seamlessly with various testing frameworks, it becomes indispensable for informed decision-making and strategic planning in QA efforts.
- TestRail
In many QA environments, TestRail proves to be an invaluable asset when creating essential QA dashboards. This tool focuses on test case management and ensures that testing is tracked and managed effectively. It consolidates data from various testing efforts, helping teams visualize their performance and identify areas for improvement. With its ability to streamline reporting, TestRail aids in maintaining high-quality standards within software development processes.
Moreover, TestRail enhances collaboration among QA team members by providing insights into current testing statuses. By choosing TestRail, QA managers have the opportunity to leverage data-driven decisions and foster a continuous improvement culture. This is especially critical in today's fast-paced tech landscape, where meeting customer expectations is paramount. Integrating TestRail into your suite of essential QA dashboards enables you to stay ahead in quality assurance initiatives and ensures that stakeholders are informed and engaged throughout the testing lifecycle.
- Azure DevOps
Azure DevOps plays a crucial role in facilitating Essential QA Dashboards. This powerful platform brings together development and quality assurance teams, enabling seamless collaboration and communication. By utilizing Azure DevOps, QA managers can easily monitor key performance metrics and track project status in real-time. This level of visibility is essential in understanding testing phases and ensuring that quality standards are met.
Within Azure DevOps, various dashboards can be crafted, focusing on specific QA needs. For instance, the Test Case Management Dashboard allows managers to visualize testing progress and coverage. Moreover, the Bug Tracking and Resolution Dashboard provides insights into reported issues, their severity, and the time taken for resolution. By harnessing these functionalities, QA managers can use Essential QA Dashboards effectively. This enhances accountability and drives continuous improvement within their teams.
- Zephyr
In the realm of quality assurance, Zephyr serves as an exemplary tool that epitomizes essential QA dashboards. It offers comprehensive capabilities for test management, which are vital for QA managers seeking to maintain high software quality standards. With a user-friendly interface, Zephyr streamlines the process of creating, tracking, and executing test cases, making it indispensable for teams focused on enhancing product delivery.
One of Zephyr's strengths lies in its robust dashboard reporting functionalities. QA teams can visualize critical metrics at a glance, such as test coverage, defect rates, and execution status. This real-time insight not only aids in decision-making but also fosters transparent communication across teams. By leveraging Zephyr's essential QA dashboards, QA managers can ensure that quality metrics are aligned with business goals, ultimately driving continuous improvement and operational excellence.
4. Performance Testing Dashboard
The Performance Testing Dashboard serves as a vital tool for Quality Assurance (QA) professionals by providing real-time insights into application stability and performance. This dashboard measures critical performance metrics, which helps teams ensure that their software can handle expected user loads efficiently. By visualizing data on system load and response times, QA managers can identify bottlenecks early in the testing process, allowing for timely interventions and enhancements.
Key components of this dashboard include monitoring system load to assess how applications perform under varying conditions. This proactive approach allows teams to observe performance trends and address potential issues before they impact end-users. Additionally, analyzing response times enables QA teams to pinpoint underperforming areas, ensuring that the software not only meets but exceeds user expectations. In conclusion, a well-structured Performance Testing Dashboard is an essential part of the QA toolkit, significantly contributing to the overall quality and reliability of software products.
Step 1: Monitoring System Load
Monitoring system load is crucial in maintaining the performance and reliability of any application. By utilizing the right QA dashboards, managers can observe real-time data on system metrics such as CPU usage, memory consumption, and response times. These insights are pivotal for understanding how well the system can handle user demands and identifying potential bottlenecks that can affect user experience. Regular monitoring ensures that resources are optimally utilized and can prevent unforeseen downtimes.
One effective way to monitor system load is through visual representations of data trends. This includes maintaining a dashboard that displays key performance indicators over time, allowing timely decisions about scaling up or optimizing resources. Additionally, integrating alerts for unusual spikes or drops in system performance can help QA managers address issues proactively. Overall, understanding how to monitor system load is an essential aspect of using QA dashboards effectively.
Step 2: Analyzing Response Times
Effective analysis of response times is pivotal in optimizing customer interactions. By focusing on response metrics, QA managers can identify areas for improvement and enhance the overall quality of service. Using the Essential QA Dashboards, you can track and analyze the time it takes for customer service representatives to respond and resolve issues effectively. This step not only highlights individual performance but also reveals trends across your team, enabling focused training where necessary.
To approach response time analysis, consider monitoring three key aspects: Average Response Time, Resolution Rate, and Call Duration. Average Response Time provides insight into how quickly your team addresses customer queries. The Resolution Rate indicates how successfully issues are being resolved in a single interaction, while Call Duration helps identify outliers, such as unusually long calls that may require further investigation. By leveraging these metrics, QA managers can systematically enhance performance and ensure that customer satisfaction remains a priority.
5. Automation Progress Dashboard
The Automation Progress Dashboard is crucial for tracking the effectiveness of your automated testing processes. It provides insights into automation coverage and enables you to assess your test framework’s effectiveness in real-time. This dashboard allows QA teams to see how many test cases are automated versus remaining manual cases, which helps in identifying gaps and prioritizing areas for future automation.
Effective tracking of automation coverage can enhance productivity and ensure that critical areas are consistently tested. Additionally, the dashboard should include metrics that reveal the performance of the current automation framework, including execution times and failed test cases. Understanding these metrics can guide teams in optimizing their automation processes. By leveraging the Automation Progress Dashboard, QA managers can not only monitor their team's progress but also make informed decisions to improve overall quality assurance practices.
Tracking Automation Coverage
Tracking automation coverage is pivotal for any Quality Assurance (QA) team aiming to enhance testing efficiency. This process involves monitoring which test cases are automated and determining the percentage of total coverage that automation provides. By clearly visualizing this data, QA managers can identify critical areas that need improvement or that may not have sufficient testing protocols in place.
To effectively track automation coverage, consider the following steps:
Define Covered Areas: Identify which features and functionalities are automated. This provides clarity on what aspects of your application are being effectively tested.
Calculate Coverage Percentage: Regularly measure the ratio of automated tests to total tests. This metric helps in understanding the overall effectiveness of your automation efforts.
Visual Reporting: Employ dashboards to visualize these metrics. Easy-to-understand visual formats will allow all team members to analyze automation coverage swiftly.
By implementing these strategies, your QA team can ensure robust and comprehensive testing, making automation an integral part of your quality assurance process.
Assessing Test Framework Effectiveness
Evaluating the effectiveness of a test framework is essential for any QA manager aiming to enhance software quality. Start by examining the test coverage, ensuring that case management is thorough and reflects realistic scenarios. The insights gathered from Essential QA Dashboards allow teams to gauge not only how many tests are automated but also the quality of those test cases and their ability to detect issues early in the development cycle.
Additionally, analyze test results and resolution data for patterns or trends. A comprehensive look at bug resolution times can reveal inefficiencies in your testing process. By comparing these metrics with industry standards, managers can identify areas for improvement. Ultimately, continuous assessment using these metrics fosters a culture of quality, laying the foundation for successful product releases and customer satisfaction. Embracing this ongoing evaluation process ensures the test framework remains agile and relevant in meeting evolving business needs.
Conclusion: Harnessing Essential QA Dashboards for Improved Outcomes
The effective use of Essential QA Dashboards is vital for enhancing overall quality assurance outcomes. By integrating these dashboards into daily operations, QA managers can streamline their processes, thereby reducing time spent on manual reporting. Automation allows managers to focus on strategic decision-making, rather than on data gathering, ultimately leading to better product quality.
Moreover, the insights garnered from these dashboards guide teams in identifying trends and potential areas for improvement. This proactive approach helps to ensure that quality standards are consistently met, fostering a culture of continuous improvement. Embracing Essential QA Dashboards empowers teams to achieve their goals and deliver exceptional results.


