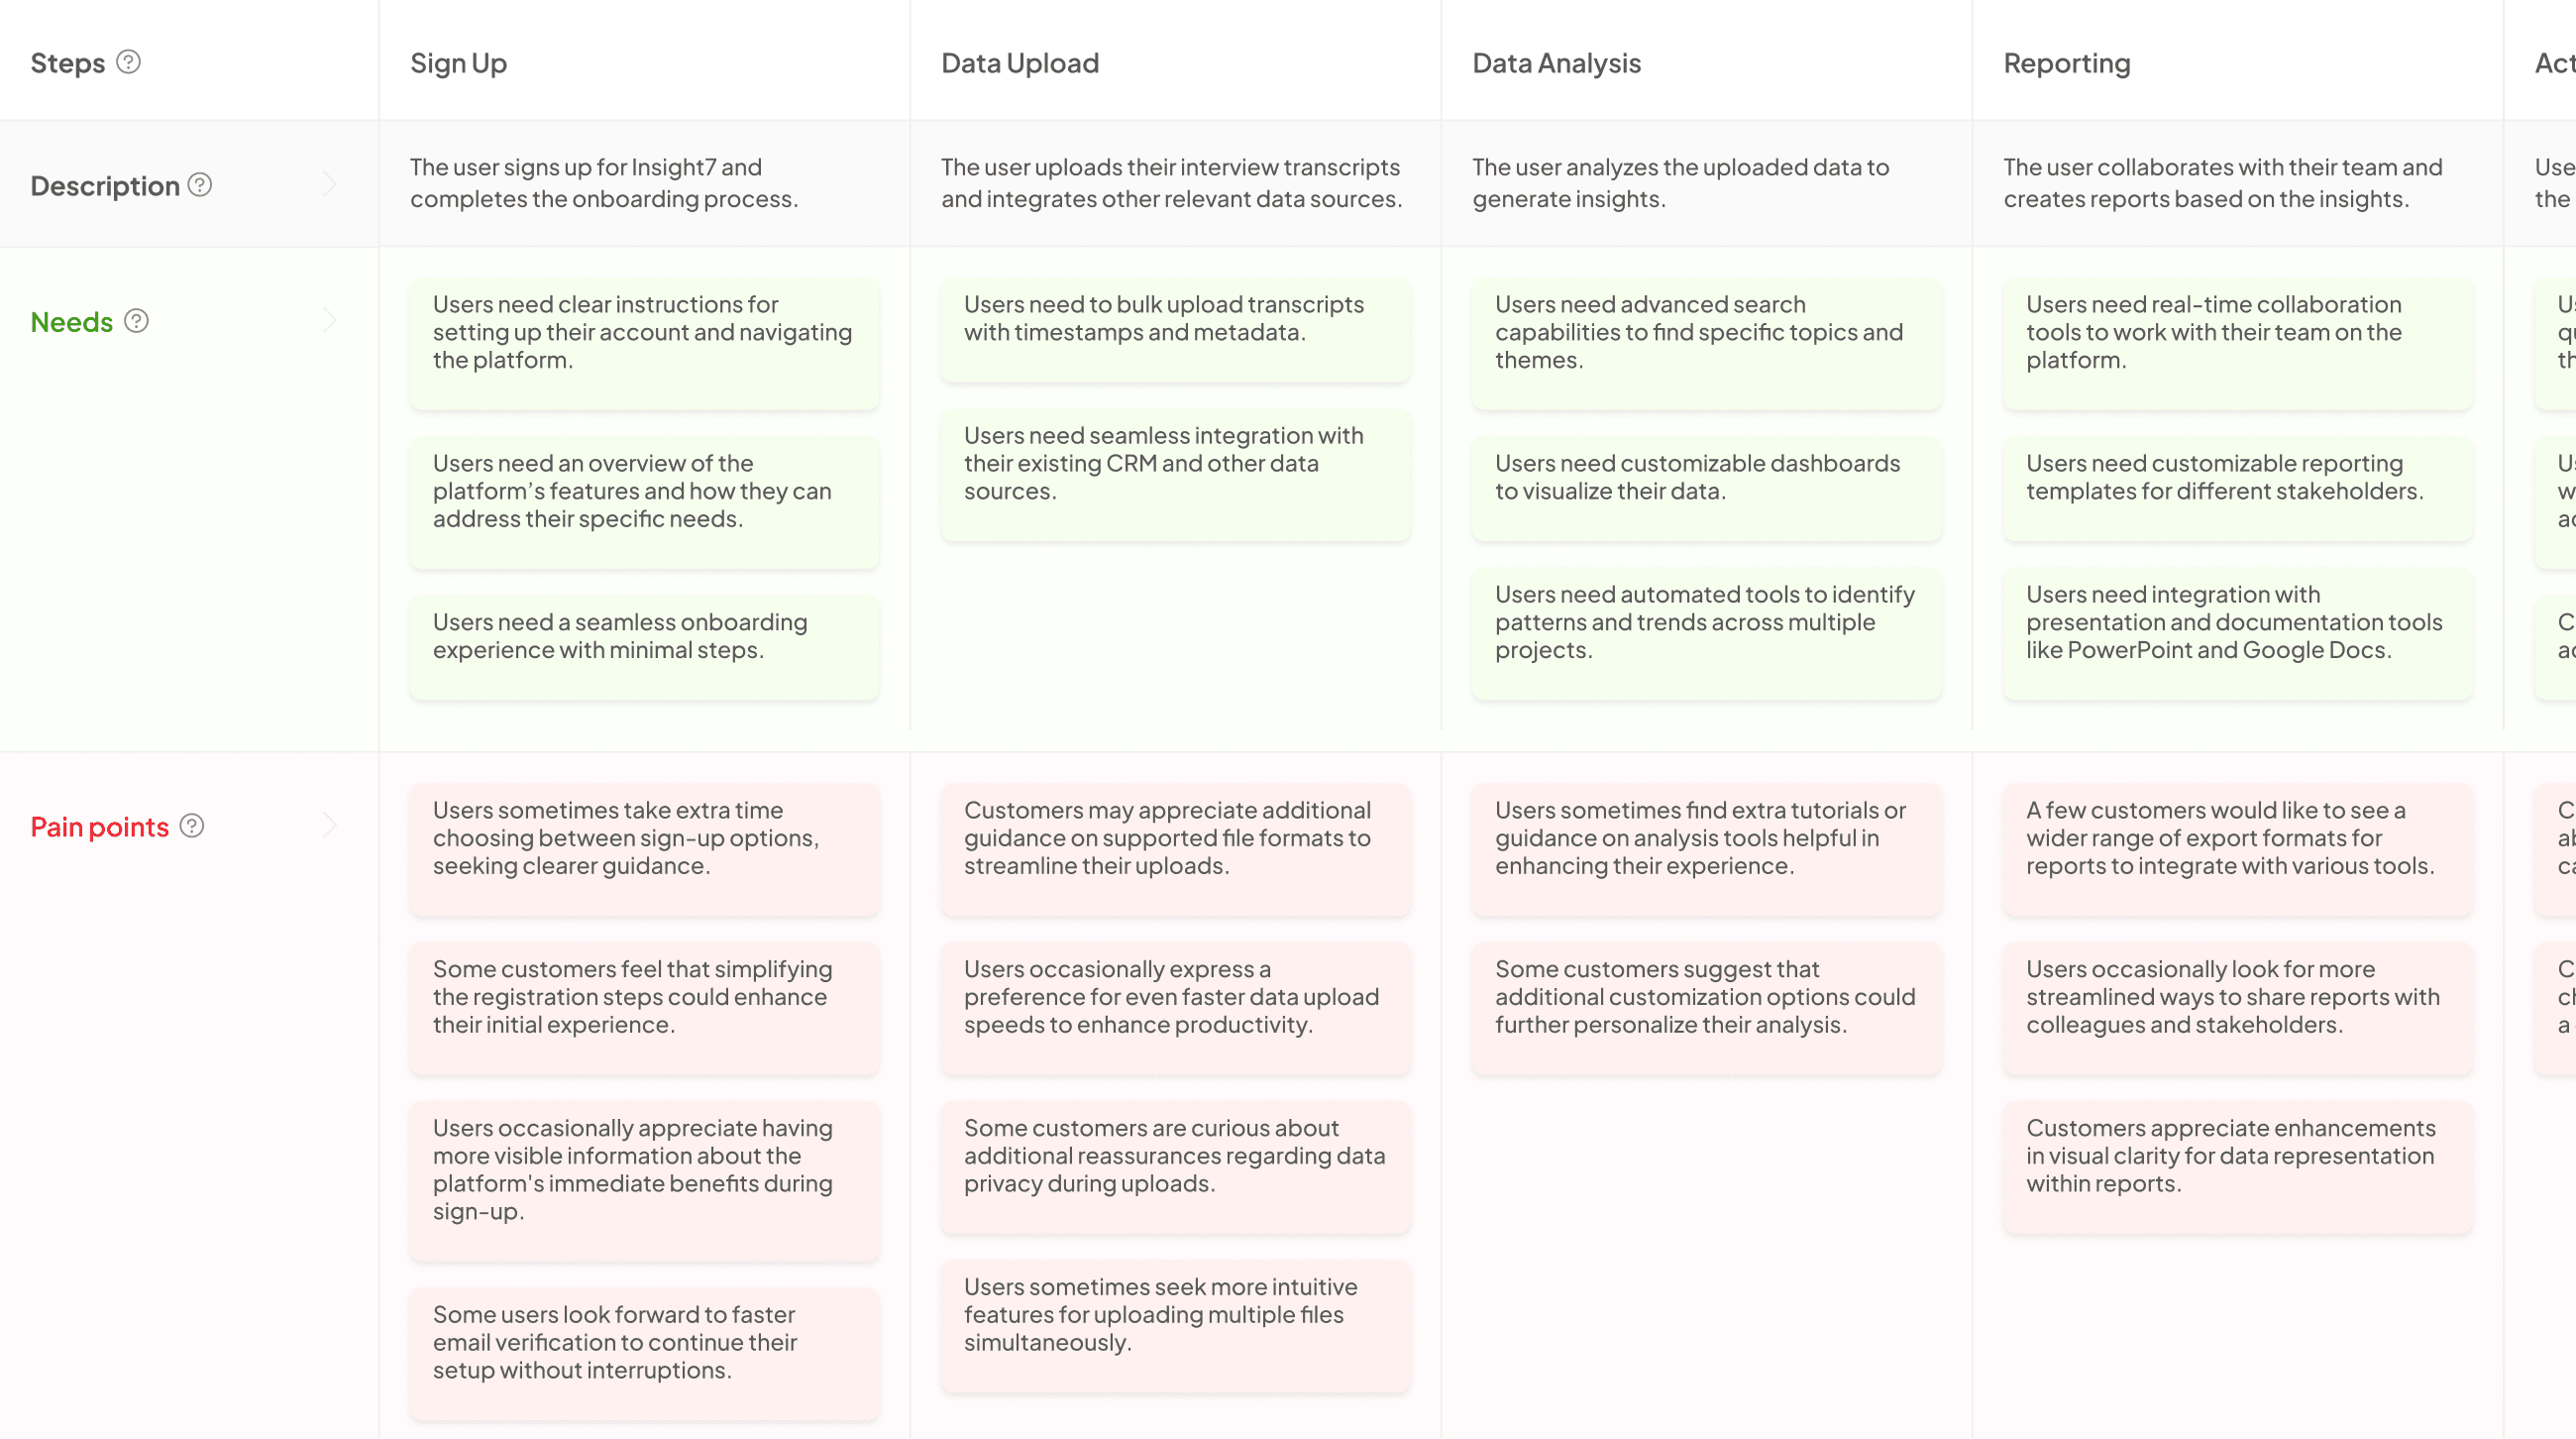
Survey Journey Mapping opens a pathway to understanding the multi-faceted experiences of users. As we navigate the complexities of customer feedback, it becomes essential to visualize their journey through open-ended surveys. This process allows us to identify key touchpoints, pain points, and insights that can shape future interactions.
By exploring each step of the customer’s journey, from initial research to decision-making, we can craft clearer and more effective strategies. This section aims to introduce the concepts and techniques essential for mapping these journeys, emphasizing the value they bring to understanding customer needs and improving overall experiences.
Extract insights from Customer & Employee Interviews. At Scale.

Importance of Visualizing Journey Maps in Surveys
Survey journey mapping is a powerful technique that helps organizations better understand the customer experience through visual representation. By transforming open-ended survey responses into a structured journey map, stakeholders can identify patterns, pain points, and opportunities in the customer journey. This visual approach allows teams to grasp complex narratives and distill insights into actionable strategies.
When journey maps are visualized effectively, complex emotional and experiential data becomes clear. Users can see how respondents interacted at each stage, revealing their thoughts and feelings. This understanding drives improvements in service design and communication, leading to a more tailored customer experience. Moreover, visual maps can serve as impactful communication tools, simplifying the messaging for stakeholders and ensuring that all team members align on customer experience objectives. By embracing this approach, organizations can enhance their understanding of user experiences through survey data, thereby refining their overall strategy.
Understanding the Basics of Survey Journey Mapping
Survey Journey Mapping is a valuable technique that helps visualize the experiences of users as they navigate through various stages of interaction. By dissecting open-ended survey responses, one can identify significant touchpoints in each user's journey. These insights allow for a deeper understanding of how users perceive their experiences, revealing both friction points and key satisfiers throughout the process.
Understanding the basics of Survey Journey Mapping involves recognizing the importance of collecting qualitative feedback. This data can be organized into a structured visual format, illustrating users' paths from initial research to final decision-making. By creating a clear visual representation, stakeholders can better grasp user sentiment and make informed decisions about improvements. This approach not only enhances user experiences but also drives strategic actions based on real feedback, ultimately leading to greater customer satisfaction.
What is Survey Journey Mapping?
Survey Journey Mapping is a strategic approach that helps organizations visualize and understand user experiences captured in open-ended survey responses. It involves creating visual representations of the customer journey, highlighting key touchpoints, pain points, and moments of delight. This mapping process serves as a powerful tool for analyzing complex data and improving user experiences by identifying friction points and emotional triggers throughout the journey.
By utilizing Survey Journey Mapping, businesses can turn qualitative data into actionable insights. This involves grouping similar responses and illustrating how users interact with products or services from their initial contact through to the decision-making phase. By visualizing this progression, organizations can better understand customer needs and preferences, paving the way for targeted improvements and tailored solutions. Ultimately, effective journey mapping enhances the overall user experience and fosters deeper connections between businesses and their customers.
Importance of Visualizing Journey Maps in Surveys
Visualizing journey maps in surveys allows organizations to better understand customer experiences over time. When stakeholders can see the progression of customer interactions, they can identify critical pain points and areas for improvement. This clarity fosters more informed decision-making, tailored to user needs. For example, mapping out the stages of a customer’s journey from initial research to post-purchase can unveil insights that may otherwise remain hidden in data analysis.
Implementing effective Survey Journey Mapping facilitates alignment among teams, ensuring everyone shares a common understanding of customer experiences. By visualizing these journeys, organizations can discover trends and patterns that support the development of enhanced products and services. The importance of this practice cannot be overstated, as it directly contributes to enriching the customer experience and optimizing overall organizational performance. With the right visualization tools, the journey map transforms complex data into actionable insights, driving consistent improvements across all customer touchpoints.
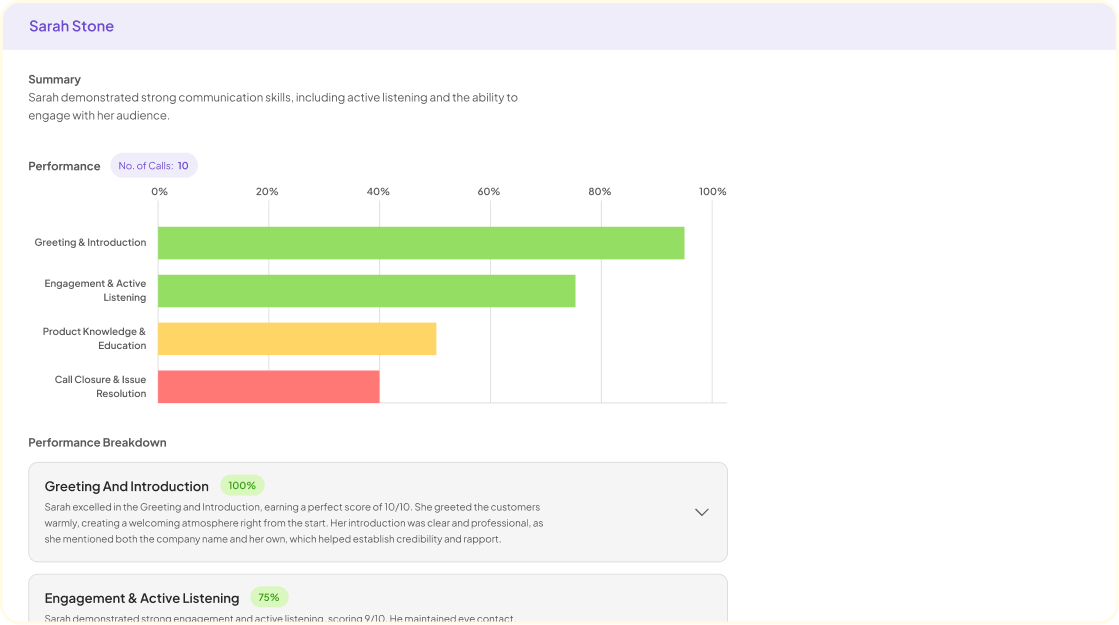
Generate Journey maps, Mind maps, Bar charts and more from your data in Minutes
Tools and Techniques for Effective Survey Journey Mapping
Effective survey journey mapping requires the right tools and techniques to visualize customer experiences accurately. Various software options allow you to transform raw survey data into actionable insights. Analyzing open-ended responses can reveal critical touchpoints in the customer journey, identifying pain points and areas for improvement.
To start, consider tools like Miro, which enables real-time collaboration and brainstorming through visual elements. Lucidchart offers a user-friendly interface, perfect for creating detailed flowcharts and diagrams. Smaply specializes in visualizing customer journeys, giving you the capability to map out the entire experience in a clear, concise manner. Lastly, Qualtrics provides robust survey tools with advanced analytics capabilities. These tools empower you to illustrate the customer journey effectively, leading to informed decision-making and improved customer satisfaction.
Insight7: Leading the Way in Journey Mapping
In the realm of Survey Journey Mapping, leading the way involves understanding the customer experience in a thorough, detailed manner. Effective journey mapping transforms open-ended survey data into actionable insights. By visualizing user experiences, organizations can identify pain points, understand customer needs, and improve overall service delivery. This process creates a compelling narrative that communicates the user’s journey at every critical touchpoint.
To excel in this domain, consider these essential aspects:
- Data Compilation: Gather responses from open-ended surveys systematically to create a rich dataset.
- Identifying Key Stages: Highlight the core stages of the customer journey, enabling clear visualization of different experiences.
- Visual Representation: Use tools to create imagery that succinctly convey the journey, helping stakeholders grasp the data intuitively.
- Insight Generation: Analyze the mapped journey for actionable insights that can steer service enhancements or product improvements.
By ensuring a comprehensive understanding of their customers’ journeys, organizations can truly stay ahead in crafting strategies that resonate with users' experiences and expectations.
Other Top Tools for Journey Mapping
When exploring survey journey mapping, various tools can significantly enhance the visualization process. Miro stands out as a versatile option, providing a collaborative platform to create interactive journey maps. Its user-friendly interface allows teams to brainstorm ideas and visualize customer experiences seamlessly.
Lucidchart offers robust diagramming features, making it ideal for illustrating complex processes and workflows. With its integration capabilities, organizations can easily connect survey data with visual representations. Smaply specializes in journey mapping and persona creation, enabling users to design detailed insight maps that identify pain points and opportunities for improvement.
Finally, Qualtrics combines experience management with journey mapping, providing powerful analytics tools. This all-in-one platform can analyze customer feedback and visualize data effectively, helping businesses understand customer pain points better. By choosing the right tool from this selection, organizations can create meaningful survey journey maps that drive actionable insights.
- Tool 1: Miro
Miro stands out as a versatile tool for visualizing journey maps derived from open-ended surveys. With its user-friendly interface, Miro enables teams to collaborate seamlessly, ensuring that insights from surveys can be transformed into compelling visual narratives. You can easily create diagrams and maps that illustrate customer experiences, helping to identify key pain points and opportunities for improvement.
To make the most out of Miro for Survey Journey Mapping, consider these essential steps:
Gather Insights: Start by compiling data from open-ended surveys, focusing on key themes and recurring issues.
Create a Template: Use Miro’s vast library of templates to establish a clear structure for your journey maps.
Collaborate: Invite team members to contribute insights and feedback in real-time, fostering a culture of collaboration.
By following these steps, teams can effectively harness Miro to visualize customer journeys and drive actionable insights from their surveys.
- Tool 2: Lucidchart
Lucidchart serves as an exceptional tool for visualizing journey maps derived from open-ended surveys. This intuitive platform allows users to create detailed diagrams and flowcharts, making it easier to comprehend complex data. Utilizing Lucidchart can significantly enhance your survey journey mapping by providing a visual representation of customer experiences and feedback. This visualization facilitates the identification of common themes, pain points, and desires expressed in survey responses.
It enables collaboration among team members, promoting a shared understanding of customer insights. With features that allow for easy integration of data from various sources, Lucidchart ensures that all relevant information is at your fingertips. By transforming raw survey data into clear, actionable visuals, this tool empowers organizations to make informed decisions, ultimately enhancing the overall customer experience. Consider leveraging Lucidchart to visualize your survey journey maps effectively, leading to insights that matter.
- Tool 3: Smaply
Smaply is an intuitive tool that excels in visualizing survey journey mapping. With its user-friendly interface, anyone in an organization can easily access and utilize its features without extensive training. As you begin, Smaply helps you compile insights from open-ended survey responses into coherent visual formats, making it simpler to identify and understand customer experiences.
One notable feature of Smaply is its ability to create journey maps that effectively highlight pain points, desires, and behaviors of customers. The platform collects qualitative data and transforms it into visual representations. Moreover, Smaply allows for collaboration among team members, facilitating discussions about customer insights and needed improvements. By utilizing Smaply, you can not only develop rich narratives from survey responses but also ensure that your findings lead to actionable strategies that enhance overall customer experience.
- Tool 4: Qualtrics
Qualtrics serves as a powerful tool for visualizing Survey Journey Mapping. It provides a seamless platform that captures feedback from open-ended surveys, translating participant insights into actionable journey maps. The intuitive interface allows users to code and categorize responses efficiently, helping to identify patterns and themes that reflect customer experiences.
Additionally, Qualtrics enables you to design dynamic visualizations that reveal the intricacies of the survey journey. You can utilize customizable dashboards to display key metrics and trends derived from the qualitative data. This helps stakeholders understand user journeys at a glance. With data-driven insights from Qualtrics, organizations can refine their services and improve customer satisfaction based on real feedback. Embracing this tool can profoundly impact your understanding of customer experiences, making it an essential component in the journey mapping process.
Conclusion: The Impact of Efficient Survey Journey Mapping
Efficient survey journey mapping can profoundly influence how organizations understand and improve customer experiences. By visualizing the journey from the initial research phase to the final decision-making stage, businesses can easily identify user pain points and unmet needs. This clarity helps in making informed decisions about service improvements, enhancing customer satisfaction and loyalty over time.
Furthermore, the insights gained from effectively mapping survey journeys can drive strategic planning and foster innovation. By prioritizing user feedback within the journey maps, organizations can better align their offerings with customer expectations. Ultimately, investing in survey journey mapping reveals opportunities for enhancing customer experiences, leading to growth and success in a competitive landscape.


