


In today's fast-paced business environment, understanding customer experiences is essential for success. The process of gathering and analyzing insights from customer interviews offers a treasure trove of valuable information. However, the challenge lies in how to make these insights visually accessible and actionable. Interview Insights Visualization plays a critical role in transforming complex data into an easily digestible format.
Effective visualization allows teams to identify patterns, pain points, and desires more straightforwardly. By leveraging visual tools, businesses can enhance their decision-making processes and ensure that every team member comprehends the customer voice. In this guide, we will explore various methods and tools that can help you visualize insights effectively, enabling a deeper connection with your target audience.

Methods for Interview Insights Visualization
To effectively visualize insights from customer interviews, one must first understand the intricacies of qualitative data. These insights often come from open-ended responses, revealing rich narratives that numbers alone may not convey. Interview insights visualization emphasizes translating these stories into compelling graphics. Consider creating visual representations like graphs, word clouds, or infographics to communicate themes and findings clearly.
Utilizing various methods ensures that the insights resonate with the audience. Begin by categorizing responses into themes, then present these themes in an engaging format. Tools such as charts can illustrate frequency, while storyboards can depict customer journeys. Remember that the ultimate goal is to make complex information accessible and actionable, fostering better understanding and quicker decision-making. This approach enhances collaboration with stakeholders, allowing them to see customer perspectives and needs vividly.
Methods for Interview Insights Visualization
To effectively visualize insights from customer interviews, one must employ several impactful methods. Firstly, distilling and summarizing qualitative data is essential. This technique allows you to identify recurring themes and significant patterns that emerge from diverse customer interactions. Utilizing tools like matrices can help aggregate specific questions from various interviews, giving you a clearer perspective on common pain points and needs.
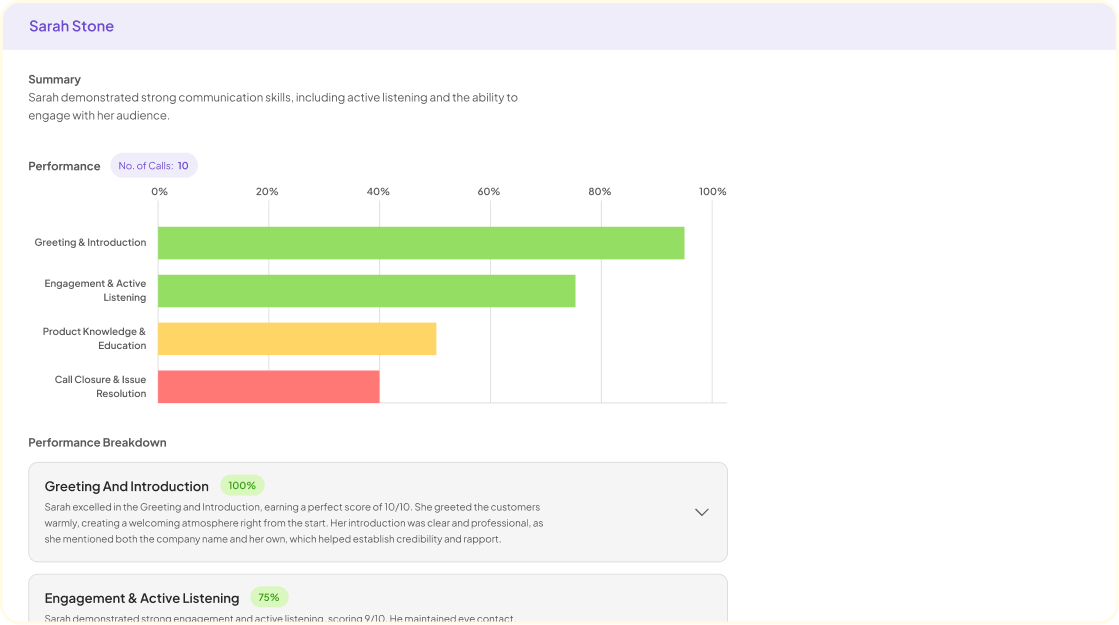
Secondly, visual representation is key. Creating visual dashboards can showcase customer journeys, highlighting essential touchpoints and areas for improvement. This method allows stakeholders to quickly grasp insights and make informed decisions based on concrete data. Additionally, transforming insights into visually compelling reports enhances communication and facilitates better understanding among team members. By combining these approaches, you can create a comprehensive overview that effectively conveys the lessons learned from your interviews.
Visualizing Qualitative Data
Visualizing qualitative data is essential for transforming insights from customer interviews into actionable knowledge. When we analyze and present this data effectively, we uncover patterns, themes, and emotions that might be lost in raw text. Utilizing visual tools helps in summarizing complex information, making it accessible for stakeholders.
To achieve effective Interview Insights Visualization, consider these approaches:
Thematic Mapping: Categorize insights based on common themes. Create visual maps highlighting these themes to assist in understanding key areas of concern or interest among customers.
Sentiment Analysis Charts: Use charts to represent customer sentiment. Positive, negative, and neutral responses can be visually depicted, showcasing the emotional landscape of customer feedback.
Comparative Analysis: Create visual comparisons of insights from different customer segments or time periods. This will help in identifying trends and changes in customer perceptions over time.
Employing these methods will enhance comprehension and drive better decision-making based on customer feedback.
Steps to Create Effective Visuals
Creating effective visuals is crucial for translating complex data from customer interviews into understandable insights. To begin, identify the key themes that emerge from your interviews. This might include positive experiences, areas for improvement, or unique customer sentiments. Highlighting these themes through visuals can facilitate a clearer understanding of customer perspectives.
Next, choose the appropriate format for your visuals. Consider charts, infographics, or mind maps, as they can effectively convey your findings. For instance, a bar chart may display the frequency of positive feedback, while a mind map can illustrate interconnected ideas. Finally, ensure your visuals are not cluttered, focusing only on essential information to maintain clarity. Effective visual representation of interview insights helps in making informed decisions that resonate with your audience's needs and expectations.
Tools for Interview Insights Visualization
To effectively visualize insights from customer interviews, a range of tools can enhance your analytical capabilities. These tools enable you to organize and interpret qualitative data in a meaningful way, leading to actionable recommendations. Utilizing dedicated software not only simplifies the visualization process but also democratizes access to insights across your organization.
Several notable tools provide robust functionalities for interview insights visualization. First, platforms like insight7 specialize in seamlessly transcribing interviews and extracting critical themes and pain points. This allows teams to view insights in context, fostering deeper understanding. Additionally, applications such as Miro facilitate collaborative brainstorming by enabling users to create visual boards, which can summarize themes discovered during interviews. Furthermore, NVivo is tailored for academic and intricate qualitative analysis, offering advanced tools to code and analyze open-ended responses effectively. By choosing the right tool, you can transform raw data into clear visuals that illuminate customer sentiments and guide strategic decisions.
insight7
Understanding the value of Interview Insights Visualization can transform the way businesses interact with their customers. Through careful examination of customer interviews, organizations can identify key themes and actionable insights that drive strategic decision-making. Streamlining the visualization process not only makes analysis efficient but also strengthens the connection between customer feedback and business strategies.
To effectively visualize these insights, start by categorizing interview data into themes. This could involve color-coding responses based on sentiment or urgency. Next, utilize charts or infographics to create visual representations of trends within the data. Lastly, regularly share these visuals with relevant teams to foster collaborative discussions. This approach ensures that insights from customer interviews are understood and implemented, encouraging a culture of continuous improvement. By prioritizing clear communication of insights, companies position themselves to excel in the competitive market.
Miro
Miro serves as a dynamic visual collaboration tool that brings interview insights visualization to life. By using Miro, teams can organize qualitative data from customer interviews in an interactive and accessible format. This platform allows you to create mind maps, affinity diagrams, and journey maps, which help in identifying key themes and patterns from the conversations conducted.
To effectively utilize Miro for visualizing interview insights, start by populating your board with notes from your interviews. Group similar responses to reveal trends and highlight important customer sentiments. The ease of collaboration in Miro enables team members to contribute ideas and interpretations, leading to a richer understanding of the data. In this way, Miro not only captures insights but fosters teamwork and innovation, driving decisions based on collective input.
NVivo
NVivo serves as a powerful tool for visualizing insights from customer interviews. With its user-friendly interface, users can manage and analyze qualitative data effectively. It offers seamless project management capabilities, allowing you to upload audio transcripts and categorize information for easier access. This organization allows marketers and researchers to quickly identify and extract valuable insights from discussions.
The application's highlighting feature enables the extraction of specific quotes and testimonials, which can be beneficial for marketing teams needing positive feedback. Additionally, NVivo supports advanced functionalities like matrix coding, helping users summarize responses from multiple interviews. By utilizing these features, you can reveal patterns and trends that are integral for strategic decision-making. With NVivo, transforming raw interview data into actionable visuals becomes an efficient process, enhancing the overall narrative of customer insights visualization.
Conclusion: Enhancing Decision Making with Interview Insights Visualization
Visualizing insights from customer interviews is a powerful tool that can significantly enhance decision-making processes. By transforming qualitative data into engaging visuals, businesses can quickly grasp patterns, trends, and sentiments expressed by customers. This approach allows teams to focus on critical feedback, differentiating between positive and negative insights. As a result, organizations can make more informed decisions that reflect their customers' true needs and priorities.
Effective interview insights visualization not only improves comprehension but also fosters collaboration among team members. Visuals act as a common language, bridging gaps between different departments and facilitating discussions about strategies and improvements. By prioritizing customer feedback through visualization, businesses can align their objectives with customer expectations, ultimately driving growth and success.
