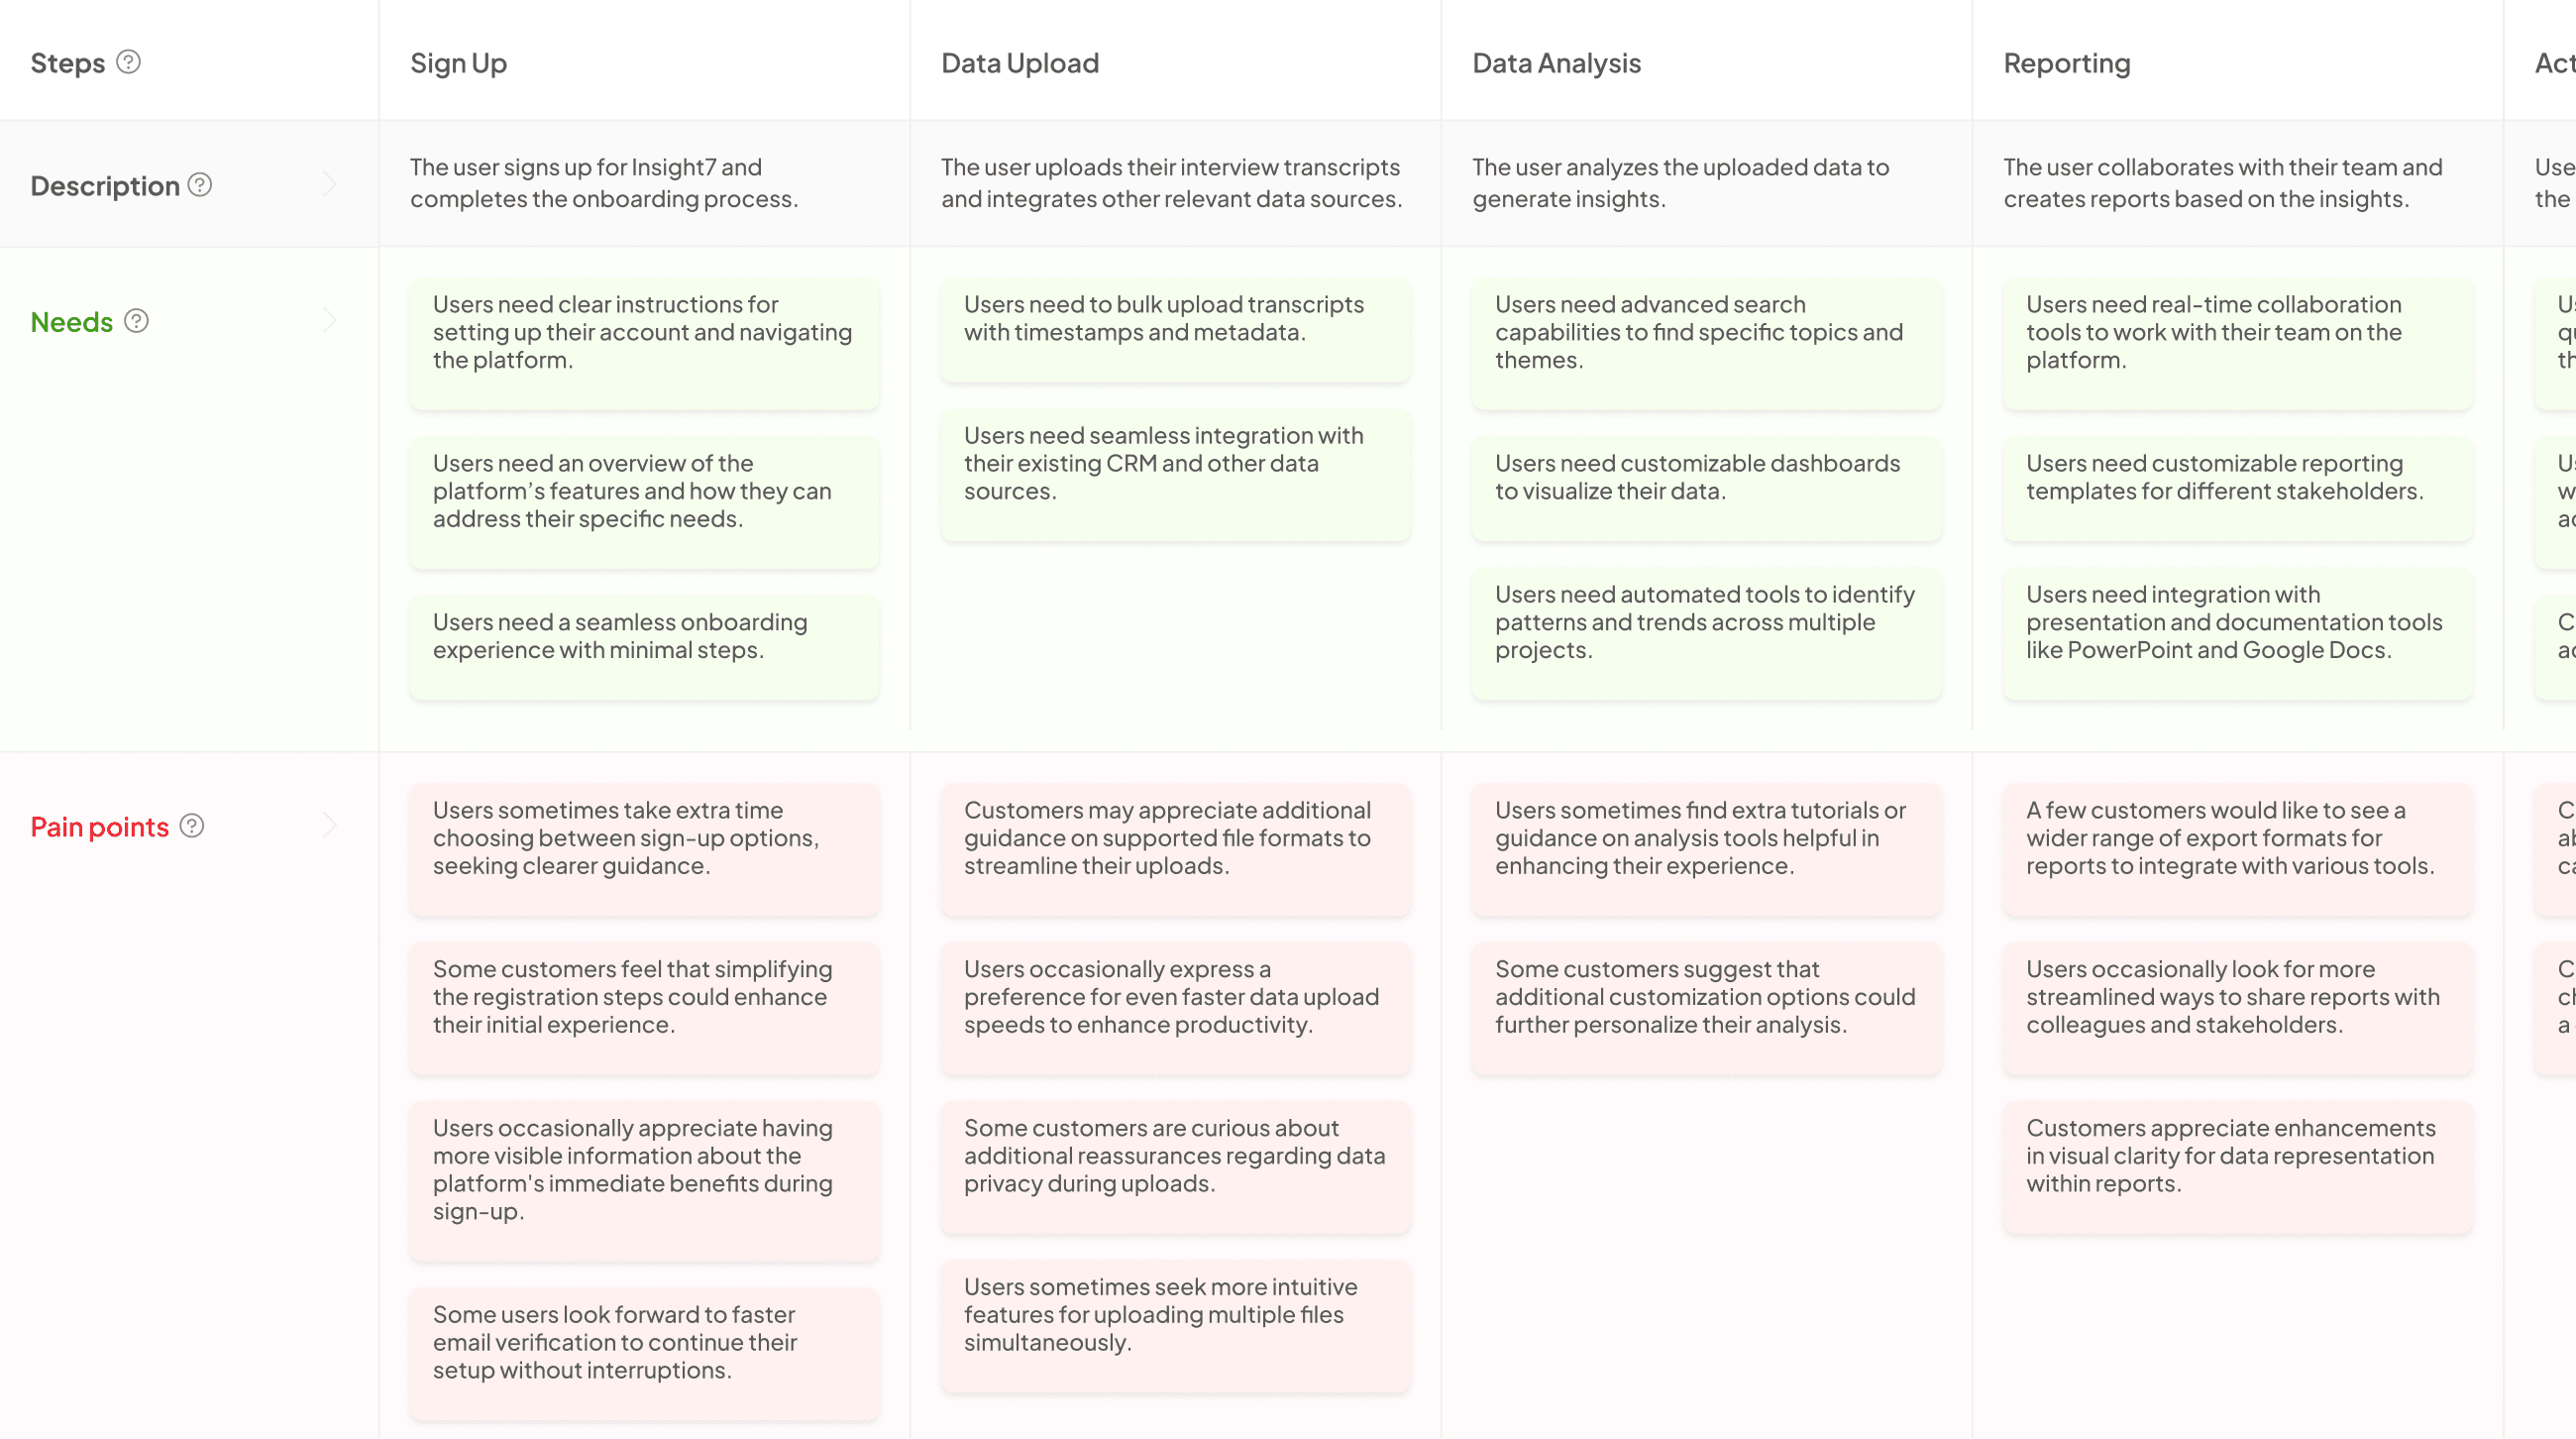
Journey Mapping Visualization serves as a powerful tool for businesses seeking to enhance customer experiences. It lays out the entire process customers go through, from their initial awareness of a brand to post-purchase advocacy. By mapping out each stage—Awareness, Consideration, Purchase, Retention, and Advocacy—teams can visualize what customers encounter along the way. This visualization helps to identify critical touchpoints, pain points, and potential opportunities for improvement.
Understanding this process is essential for making informed decisions. It enables teams across marketing, sales, and support to collaborate effectively, ensuring consistency throughout the customer experience. By converting disparate data into a cohesive visual narrative, Journey Mapping Visualization pinpoints areas that need attention. Ultimately, focusing on the customer’s journey facilitates stronger connections and leads to lasting loyalty.
Extract insights from Customer & Employee Interviews. At Scale.

Effective Techniques for Journey Mapping Visualization
Effective techniques for journey mapping visualization play a critical role in understanding customer experiences. By accurately capturing the various stages of a journey, from Awareness to Advocacy, organizations can visualize the complete customer experience. This starts with clearly mapping out key touchpoints such as websites, emails, and customer support interactions. Identifying these interactions provides insights into customer behavior and preferences.
Additionally, spotlighting pain points allows businesses to understand where customers may encounter frustrations. This understanding is vital for pinpointing opportunities for enhancement and creating a seamless, memorable experience. It’s essential to transform scattered data into a cohesive visualization, ensuring that all teams—marketing, sales, and support—are aligned and working towards common goals. By employing these techniques, organizations can foster improved decision-making and optimize every aspect of the customer journey, ultimately leading to higher customer satisfaction and loyalty.
Utilizing Infographics for Customer Insights
Infographics serve as a powerful tool to enhance customer journey mapping visualization. By translating complex data into visually engaging graphics, businesses can identify key patterns and trends in customer behavior. This visual representation allows teams to understand not just where customers encounter obstacles but also what influences their decisions at each stage of the journey. Using infographics helps to distill large amounts of information into digestible pieces, making insights accessible across diverse teams.
Moreover, infographics can foster better communication and collaboration. Marketing teams can share visual snippets of customer behaviors, while customer experience teams gain clarity on friction points. The compelling presentation of data strengthens the case for actionable improvements, enabling organizations to address customer needs effectively. Utilizing infographics not only empowers teams but also establishes a foundation for data-driven decision-making throughout the customer journey.
Implementing Interactive Dashboards for Dynamic Analysis
Interactive dashboards serve as powerful tools for presenting Journey Mapping Visualization, enabling users to probe deeper into customer data dynamically. Through these dashboards, organizations can visualize each stage of the customer journey, from awareness to purchase, and even post-purchase experiences. Enhanced interactivity allows stakeholders to filter data, identify trends, and gain insights tailored to their specific queries.
To successfully implement these dashboards, consider these key aspects:
- User-Centric Design: Ensure the dashboard meets the needs of its users, prioritizing ease of navigation and clarity.
- Data Integration: Combine various data sources to present a holistic view of the customer journey.
- Real-Time Updates: Keep data current to facilitate timely decision-making and responsiveness to customer behavior.
- Interactive Features: Incorporate filtering options and drill-down capabilities for detailed analysis.
- Custom Reporting: Provide options to generate customized reports for in-depth assessments of specific metrics or themes.
By focusing on these areas, organizations can create interactive dashboards that enrich the understanding of customer journeys and improve overall strategic planning.
Generate Journey maps, Mind maps, Bar charts and more from your data in Minutes
Advanced Journey Mapping Visualization Strategies
Advanced journey mapping visualization strategies offer tools to deepen insights into customer behavior. By adopting sophisticated techniques, businesses can transform raw data into actionable narratives. Begin with detailed journey maps that highlight stages, such as Awareness and Consideration. These visual aids not only represent customer interactions but also synthesize multi-channel touchpoints, creating a seamless understanding of the customer experience.
Consider implementing various visualization methods, including emotional journey simulations and heat maps. Emotional journey simulations can showcase customers’ feelings at each stage, helping identify pain points swiftly. Heat maps, on the other hand, illustrate where customers focus their attention on websites or apps, revealing optimization opportunities. Utilizing these advanced strategies promotes a culture of continuous improvement, making it easier to enhance the customer journey effectively. The goal is to turn insights into actions, ultimately fostering deeper customer relationships.
Integrating Heatmaps for Enhanced User Experience
Heatmaps offer a dynamic way to visualize customer interactions, providing immediate insight into user behavior. By integrating heatmaps into your journey mapping visualization, you can identify which areas of a website or app captivate users the most. This visualization technique highlights the hottest spots, clarifying where users click, scroll, and linger. In doing so, it helps stakeholders understand the areas that require attention, enabling targeted enhancements to the user experience.
To effectively utilize heatmaps, consider these approaches:
- Identifying User Engagement: Analyze where users are most engaged to enhance those areas further.
- Optimizing Layout: Use heatmaps to inform design changes that improve navigation and overall user satisfaction.
- Informing A/B Testing: Implement heatmap data in A/B tests to drive decisions on which layouts or features to prioritize.
Integrating these insights will not only enhance user experience but also create a more intuitive and satisfying journey for customers.
Leveraging Customer Personas in Visualization
Understanding customer personas is key in the realm of Journey Mapping Visualization. By creating detailed profiles of your customers, you can visualize their unique journeys effectively. These personas provide insights into behaviors, preferences, and pain points that shape their experiences. When you incorporate these personas into your visualizations, you can tell a more compelling story about your customer interactions.
To enhance your journey mapping efforts, consider these approaches. First, segment your personas based on factors like demographics and buying behavior. This allows you to tailor visualizations that resonate with each segment. Next, utilize the insights gathered to pinpoint critical touchpoints on the customer journey. Finally, regularly update your personas as customer responses evolve, ensuring that your visualizations remain relevant. By integrating customer personas into your Journey Mapping Visualization efforts, you create a dynamic tool that illuminates the customer experience, helping your team make informed decisions that drive engagement and satisfaction.
Conclusion: Mastering Journey Mapping Visualization Techniques
Mastering journey mapping visualization techniques is essential for understanding and enhancing the customer experience. By effectively presenting the stages, touchpoints, pain points, and opportunities in a visual format, organizations can gain a holistic view of the customer journey. This clarity transforms complex data into actionable insights, bridging gaps between departments like marketing, sales, and customer support.
Extract insights from Customer & Employee Interviews. At Scale.

Moreover, a well-crafted visualization helps identify key areas for improvement. It allows teams to focus on optimizing every customer interaction, leading to increased satisfaction and loyalty. Ultimately, mastering these techniques not only enriches the customer experience but also drives better business outcomes.


