


In today's data-driven world, AI-Powered Visualization Tools play a crucial role in transforming raw insights from buyer interviews into understandable and actionable reports. An effective visualization tool can bridge the gap between complex data sets and clear insights, enabling businesses to decipher customer sentiments and preferences quickly. By utilizing these tools, teams can distill vast amounts of information into meaningful visual formats that enhance decision-making processes.
Moreover, the ability to automate and streamline this visualization aids in more efficient project management. With AI-powered solutions, businesses can easily analyze large clusters of buyer conversations, identifying pain points and desires without spending excessive time sifting through data. This not only fosters a deeper understanding of customer needs but also supports a culture of data-informed decision-making across various teams.

The Importance of AI-Powered Visualization Tools in Analyzing Buyer Interviews
AI-Powered Visualization Tools play a crucial role in transforming raw buyer interview data into meaningful insights. When businesses gather information through interviews, the data can be overwhelming and disorganized. Traditional analysis methods often fall short, leading to delayed decision-making and inefficient collaboration. AI-powered tools streamline this process, enabling organizations to visualize insights quickly, ensuring that critical information can guide strategies effectively.
By employing these advanced visualization tools, companies can identify key trends and patterns that emerge from buyer interviews. For instance, visual representations can highlight recurring themes, enabling teams to focus on consumer needs that warrant immediate attention. This analytical clarity fosters collaboration among stakeholders and facilitates timely actions based on customer feedback. Ultimately, harnessing AI-powered visualization tools empowers businesses to stay competitive and responsive in an ever-evolving market.
Enhancing Understanding with AI-Powered Visualization Tools
AI-powered visualization tools are transforming how we interpret buyer interview reports. By converting raw data into engaging visuals, these tools help uncover essential insights rapidly. When analyzing interviews, the ability to visualize responses can clarify complex patterns and highlight key emotional responses that may otherwise get lost in text.
Utilizing these tools encourages a more profound understanding of customer feedback. For instance, you can visualize both positive and negative responses to identify trends over time. This visual representation aids teams in recognizing customer needs, ultimately informing product development. By making the data accessible and comprehensible, stakeholders can drive actionable outcomes that resonate with buyers. Embracing AI-powered visualization tools is essential for making informed decisions based on buyer interviews, ensuring that every valuable insight is recognized and leveraged.
Identifying Key Patterns and Trends through AI-Powered Visualization Tools
AI-powered visualization tools significantly enhance the process of identifying key patterns and trends from buyer interviews. By consolidating large volumes of qualitative data, these tools allow for a more straightforward analysis of customer feedback. They transform raw interview transcripts into visually engaging formats, making it easier to detect recurring themes and insights. For instance, users can input multiple interviews into a single project, and the software will highlight major pain points and trending topics, such as a striking percentage of customers mentioning a specific issue.
Moreover, AI-powered visualization tools create comprehensive dashboards that track customer journeys, pinpointing needs and challenges at every step. By presenting data in intuitive charts and graphs, these tools facilitate a more profound understanding of customer sentiments. This can lead to actionable insights that drive strategic decision-making, ensuring that organizations stay aligned with their customers’ evolving needs. With these powerful tools, turning insights from buyer interviews into impactful strategies becomes a streamlined and effective process.
Top AI-Powered Visualization Tools for Buyer Interview Reports
In today’s data-driven environment, AI-powered visualization tools are essential for transforming buyer interview reports into actionable insights. These tools not only simplify the presentation of data but also enhance the understanding of intricate patterns and themes that can emerge from qualitative feedback. Exploring multiple AI-powered visualization tools can help businesses effectively analyze buyer interviews, ensuring all relevant data is expressed clearly and comprehensively.
When evaluating the top AI-powered visualization tools for buyer interview reports, consider their unique capabilities. For instance, some tools automatically generate insights from conversations, highlighting pain points and desires. Others offer interactive dashboards that make data exploration intuitive and efficient. Tools like Microsoft Power BI and Google Data Studio cater to businesses seeking user-friendly solutions that facilitate collaboration while providing in-depth analytical features. Ultimately, selecting the right tool tailored to your needs can dramatically elevate the quality of your buyer interview reporting.
Insight7: Your Go-To AI-Powered Visualization Tool
AI-powered visualization tools have become essential for turning buyer interviews into actionable insights. Insight7 stands out as a user-friendly platform designed for ease of access, allowing any team member to engage with data without needing extensive training. From its homepage, users can effortlessly start generating reports or transcribing user interactions. This accessibility democratizes insights, enabling everyone in the company to contribute to the analysis.
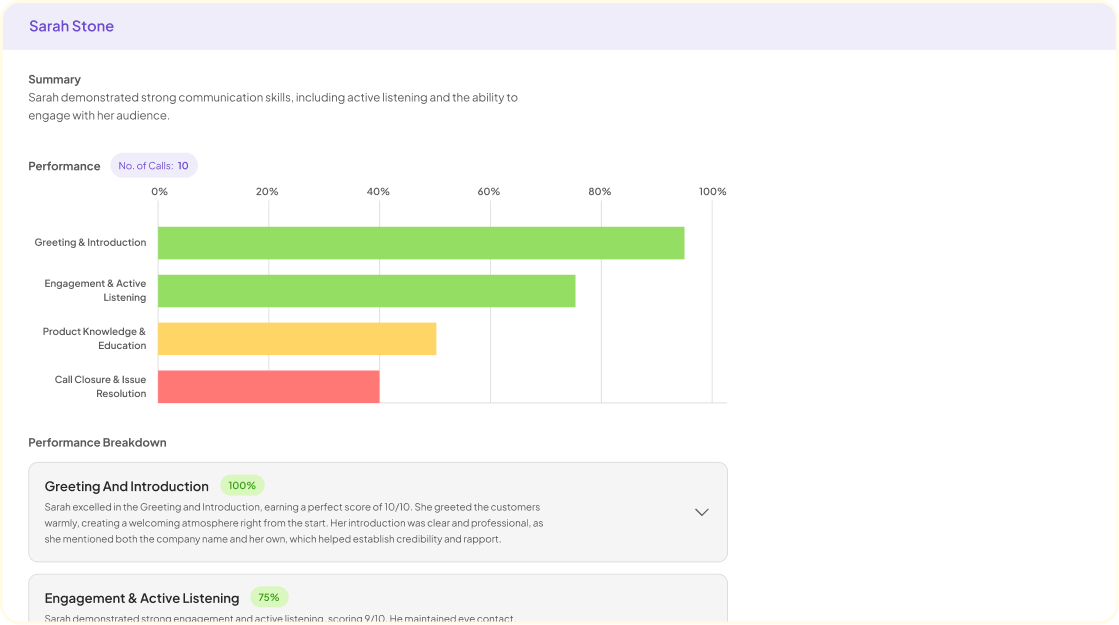
The platform organizes all call files into a library, where users can visualize conversations and extract meaningful insights. Insight7 automatically highlights pain points, desires, and behaviors, crafting a narrative around customer feedback. Users can delve into specific conversations to pull out key evidence and summarize findings with relevant keywords. This capability not only aids in identifying emerging themes across multiple interviews but also allows for a comprehensive understanding of customer sentiment. By consolidating insights in one space, Insight7 simplifies the complex process of analyzing buyer feedback, making it an invaluable tool for teams aiming to enhance their decision-making processes.
Tableau: Advanced Data Visualization and Analysis
Tableau stands out as a powerful platform for advanced data visualization and analysis, particularly in transforming buyer interview reports. By employing intuitive dashboards, Tableau simplifies complex datasets, allowing teams to glean actionable insights with ease. This tool enables users to create dynamic visualizations that illustrate customer sentiments, highlighting both positive and negative feedback from interviews.
Through its AI-powered visualization capabilities, Tableau helps to identify key trends and patterns within the data. Users can conduct comparative analyses, discovering insights that inform strategic decisions based on customer feedback. Moreover, Tableau's user-friendly interface ensures that even those with minimal technical experience can navigate and utilize its features effectively. This fosters collaboration among team members as they work together to derive meaning from their findings, ultimately driving better business outcomes.
Microsoft Power BI: Interactive Data Reports with AI Support
Microsoft Power BI stands out as an exceptional AI-powered visualization tool designed to create interactive data reports effortlessly. With its intuitive interface, users can easily transform complex data sets derived from buyer interviews into meaningful insights. The integration of artificial intelligence enhances analytical capabilities, enabling users to uncover trends and patterns that may otherwise go unnoticed. This tool empowers organizations to tailor their reporting needs, ensuring that relevant data is always at their fingertips.
In practice, Power BI offers a variety of functionalities, such as automated report generation and dashboard customizations. Users can choose between self-service options, where they can explore data themselves, or more structured setups that provide routine reports. Importantly, the ability to collaborate and refine reports in real-time allows teams to adapt and respond swiftly to insights gained from buyer interviews. Overall, Microsoft Power BI exemplifies how AI-powered visualization tools can facilitate deeper understanding and strategic decision-making in organizations.
Google Data Studio: Simplifying Data Visualization for Interviews
Google Data Studio offers a streamlined approach for visualizing data from buyer interviews. This tool is particularly beneficial for synthesizing various insights in an accessible format. By enabling users to create interactive reports, it ensures that stakeholders can easily interpret data and make informed decisions. The ability to connect multiple data sources enhances the depth of analysis, so users benefit from more comprehensive views.
When leveraging Google Data Studio for interviews, users can employ various visualization formats, such as charts and graphs, to highlight key sentiments. These visual representations aid in quickly identifying trends, whether positive or negative, making it easier to address areas for improvement. Additionally, collaborative features allow teams to discuss findings in real-time, fostering a more dynamic approach to data interpretation. Ultimately, Google Data Studio simplifies the complexities of data visualization, making it a valuable AI-powered visualization tool for enhancing report quality from buyer interviews.
Conclusion: Choosing the Right AI-Powered Visualization Tool for Your Needs
Selecting the right AI-powered visualization tool for your needs is crucial for effectively translating buyer interview insights into actionable data. With various options available, consider factors such as user-friendliness, functionalities, and integration capabilities. Each tool you evaluate should align with your specific reporting requirements, allowing you to visualize buyer feedback in a way that is both meaningful and accessible.
Furthermore, take time to explore how each tool can enhance your understanding of customer sentiments. Different tools may offer unique features, such as advanced filtering, real-time analytics, or user-friendly dashboards. The goal is to choose an AI-powered visualization tool that not only meets your current needs but also adapts as your data needs evolve over time.
